Linear regressions and confidence intervals
My one remaining use of Gnumeric had been the regression statistical function which produced confidence intervals for slopes and intercepts along with p-values against a null hypothesis that either one was zero. With Gnumeric having opted to be "Linux only" in 2014, I wanted to have some of those same capabilities in cross-platform LibreOffice.org. Although the LibreOffice 5 includes a statistics add-in by default with a regression option, that option did not produce the values I sought.
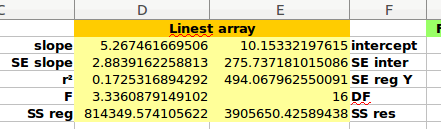
The core to the solution was on board LibreOffice all along. The LINEST function, entered as an array formula produces the values necessary to generate confidence intervals.

When entered into a two by five array of cells as an array formula, the results of the function generate standard error values for the slope and intercept. The values generated by LINEST can then be used to feed other functions.

Values such as t-critical, the margin of error, bounds on the confidence intervals, and values from a test against the being zero or the y-intercept being zero are al possible. In this particular case the data has a number of problems some of which could be ameliorated and others which cannot. The data set is from a physical science class laboratory where students were using force on an x-axis to determine whether sandpaper grit, surface area, or sled weight most affected the force of sliding friction. To gain a common x-axis, the measured force was put on x and the other variables were treated as y variables.

The formulas driving the calculations can be seen above. While I was working on the above I also decided I wanted to graphically show the spread in the predicted values for y. I calculated the 95% confidence interval for the y-values.

The predicted value is the value based on the slope and intercept. The formula for the lower bound can be seen below, the upper changes only the sign.


I am indebted to Charles Zaiontz' site Real Statistics Using Excel, M.G. Bulmer's Principles of Statistics, and notes on the LINEST function at Colby. All errors and misunderstandings are mine.
The core to the solution was on board LibreOffice all along. The LINEST function, entered as an array formula produces the values necessary to generate confidence intervals.
When entered into a two by five array of cells as an array formula, the results of the function generate standard error values for the slope and intercept. The values generated by LINEST can then be used to feed other functions.

Values such as t-critical, the margin of error, bounds on the confidence intervals, and values from a test against the being zero or the y-intercept being zero are al possible. In this particular case the data has a number of problems some of which could be ameliorated and others which cannot. The data set is from a physical science class laboratory where students were using force on an x-axis to determine whether sandpaper grit, surface area, or sled weight most affected the force of sliding friction. To gain a common x-axis, the measured force was put on x and the other variables were treated as y variables.

The formulas driving the calculations can be seen above. While I was working on the above I also decided I wanted to graphically show the spread in the predicted values for y. I calculated the 95% confidence interval for the y-values.

The predicted value is the value based on the slope and intercept. The formula for the lower bound can be seen below, the upper changes only the sign.
The above table permits producing a chart that shows the confidence intervals graphically.

I am indebted to Charles Zaiontz' site Real Statistics Using Excel, M.G. Bulmer's Principles of Statistics, and notes on the LINEST function at Colby. All errors and misunderstandings are mine.


Comments
Post a Comment