RipStik linear acceleration
Although this demonstration went well last term, this term my acceleration was uneven and my timing was off. Not having any sidewalk chalk left was a factor in making hitting the timing marks, but I also just was not able to get a good smooth acceleration this term.

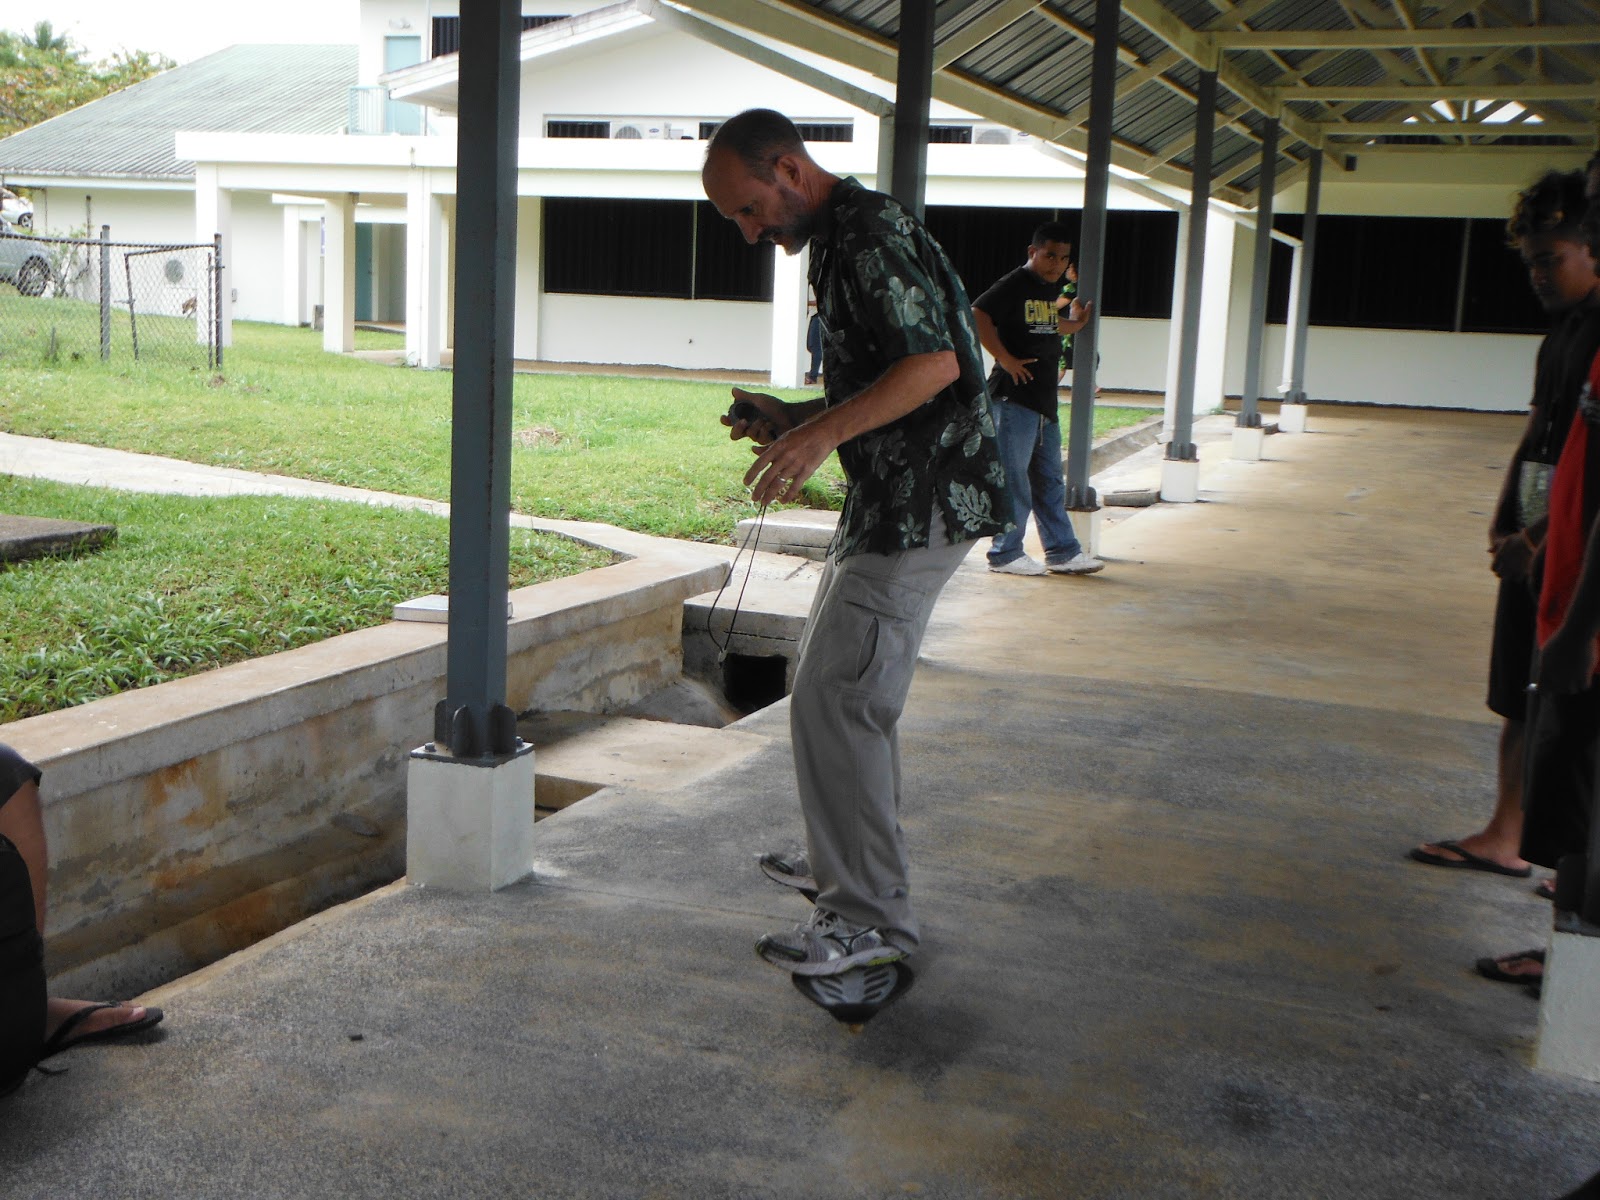
I began as I did last term from the post at the sidewalk junction, running times off of 100, 200, 300, 400, 600, and 800 centimeters.

The unsteady line of travel probably did not help, and seeing the marks was problematic.

I actually made multiple runs, having to redo a run when a student I was using as the 800 cm reference point moved.

With time winding down, I went with a run that felt uneven in its acceleration.

Data was shared in the field.

The raw data from the final acceleration run. An analysis of the data confirmed that my acceleration had been very uneven, and my timing also appears to be have been in error.
Note my point-to-point velocity swinging up and down at every timing point. A graph of the data reveals the extent of the problems in the run.


I began as I did last term from the post at the sidewalk junction, running times off of 100, 200, 300, 400, 600, and 800 centimeters.

The unsteady line of travel probably did not help, and seeing the marks was problematic.
I actually made multiple runs, having to redo a run when a student I was using as the 800 cm reference point moved.

With time winding down, I went with a run that felt uneven in its acceleration.

Data was shared in the field.

| time(s) | distance(cm) | velocity (cm/s) | acceleration (cm/s²) |
| 0 | 0 | 0 | 52 |
| 0.97 | 100 | 103 | 106 |
| 2.09 | 200 | 89 | -12 |
| 2.83 | 300 | 135 | 62 |
| 3.82 | 400 | 101 | -34 |
| 4.56 | 600 | 270 | 229 |
| 5.41 | 800 | 235 | -41 |

Unlike last fall where the accelerations agreed across the equations, this term there was no agreement.
Average of accelerations: 51.50 cm/s²
Quadratic acceleration: 36.6 cm/s²
Linear acceleration estimate: 41.3 cm/s²
Acceleration discrete second derivative best fit: 60.5 cm/s²
The concept was shown last fall to be essentially sound, I need a steadier rise in speed, perhaps slower up front, and far clearer chalk marks. Today the 200 came too fast. Perhaps a 0, 100, 300, 600, 1000 centimeter sequence be more manageable?
Wednesday is then spent showing how velocity is changing in the Monday data and the resulting acceleration. Wednesday now needs some work: there is an opportunity in there somewhere to break up the students into groups and have them engage in a more exploratory approach to determining the velocity changes along the curve. A more inquiry oriented approach.
Wednesday is then spent showing how velocity is changing in the Monday data and the resulting acceleration. Wednesday now needs some work: there is an opportunity in there somewhere to break up the students into groups and have them engage in a more exploratory approach to determining the velocity changes along the curve. A more inquiry oriented approach.


Comments
Post a Comment