Reflection and Refraction
Laboratory eleven followed a compressed week.Week eight had ended with the El Niñp presentations not yet completed. Those presentations continued on the Monday of week nine. This pushed the RipStik wave back to Wednesday and knocked out the chain and ball demonstrations on week nine Wednesday. Pay back for the loss would be academic collapse on the week nine Friday assessment.

Monday week ten was already committed to Color and Light in MITC. Wednesday I went to demonstrate the chain wave as a prelude to covering 094. There was no chain in the cabinet. Evaporated. Steel chain can evaporate, perhaps sublimate, here in the tropics. Temperatures get that high.

I pulled out the rope and used the rope as seen at the end of the article on measuring the speed of sound. With the demonstration and coverage of 094, only the remaining half of the period could be devoted to a quick romp through the spectrum.

Week ten ended with a third Friday of no classes. Liberation day back in December, a staff development day in early October, and now UN day observed all landing on Friday.

Week eleven should have started with the Light and Optics video, but some students were excused as part of a forum involving Pohnpei state. The vast majority of my students this term are Pohnpei state residents, the forum had value for them as well. The forum, was, quite frankly, a historic first and were I Pohnpei state student I would certainly have skipped class to go to the forum. College is not just about what happens inside the classroom or on the campus outside the classroom. College is also a time of maturing into a socially and politically aware adult.

This pushed the video to Wednesday and added some material to the reflection and refraction lab on Thursday.

The laboratory is simple in design. This is in part to prevent trigonometric mathematics (which only a few students in the class have been exposed to) from obscuring the science. With time, effort, and resources I could use lasers and protractors to measure the sine of the angles involved in refraction. The math, however, would turn the laboratory into a mysterious black box, meaningless values for the students. Newton mastered the mathematics of trigonometry first, and then apparently perceived his world through the lens of that mathematics. He saw a mathematically driven world, but he already had much of the mathematics on board.

This laboratory measures the actual depth of a penny and the apparent depth. The ratio is an estimate of the index of refraction of light for water. Different depths provide different data points, that leads to a linear regression, a linear model, and the class is right back on the familiar ground of a linear regression. Think of the course as something like sixteen weeks of y = mx + b. The hope is that linear equation will become familiar terrain, a cognitive hook upon which the students can hang future ideas and understandings. If the class really connects, then they will see linear relationships in the world around them long after the class ends. They will watch their kid ride a skateboard and know that a linear regression is underneath that motion in time and space. Bearing in mind most students in the course are not science majors, that way of seeing the world would not be expected of them. Yet being able to access and apprehend that understanding of the world has intrinsic value in this day and age of science and technology. Is global warming linear or non-linear? These students of the islands may have a better idea of what is being discussed in that sentence.

While I note that the ratio of the actual depth to the apparent depth - the slope of the line - is the refraction of water, I do not tell the students the value. That they have look up.

I also do not explain what the relationship should be between the object distance and image distance for the reflection portion of this laboratory. I let the students propose a relationship. Every term someone suggests that the two distances could be equal. I then name the hypothesis using their last name, or if two people jump to it together, I hyphenate the hypothesis. This term we had the Walter-Daniel theory, which Daniel then dutifully set up disproving.

In the afternoon we had the Billen hypothesis that the slope would be equal to one and the Gilmete hypothesis that the slope would be greater than one - the object distance would exceed the image distance.

Ryan and Sahn had data that appeared to be problematic - image distances for reflection varying almost randomly. I was unable to determine how they had arrived at the data they had already gathered. I do not, however, make a habit of telling the students that what they have measured is wrong. I might point out that the data is not congruent to what other students are finding. The spirit of the class is in keeping with the The Royal Society of London's motto, 'Nullius in verba.' "'Nullius in verba' is taken to mean 'take nobody's word for it'. It is an expression of the determination of Fellows to withstand the domination of authority and to verify all statements by an appeal to facts determined by experiment." They did the experiment, they have their data, my disputing that data would be asking them to take my word over their data. The students had already been warned at the start of the term to heed William Gilbert's advice, "handle the bodies carefully, skilfully, and deftly, not heedlessly and bunglingly." Take no one's word for it, but measure carefully. Repeatedly.

Final conclusions on the status of the hypotheses will not be known until the laboratory reports are written up. These are no cookbook style laboratories, these are each written up as a report.


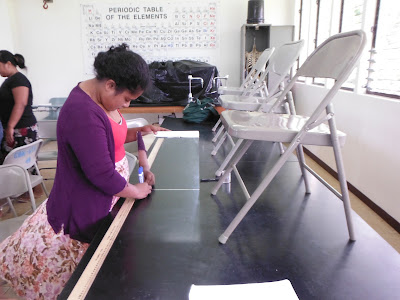


Veralyn, Petery, and Darlynda work on apparent depth
Monday week ten was already committed to Color and Light in MITC. Wednesday I went to demonstrate the chain wave as a prelude to covering 094. There was no chain in the cabinet. Evaporated. Steel chain can evaporate, perhaps sublimate, here in the tropics. Temperatures get that high.

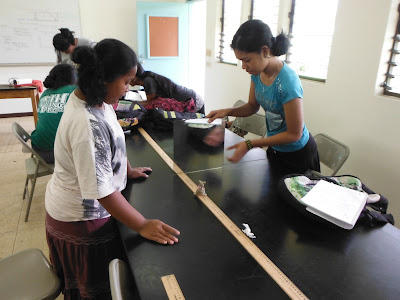
Macy measures the actual depth of a penny Marsha records data
I pulled out the rope and used the rope as seen at the end of the article on measuring the speed of sound. With the demonstration and coverage of 094, only the remaining half of the period could be devoted to a quick romp through the spectrum.
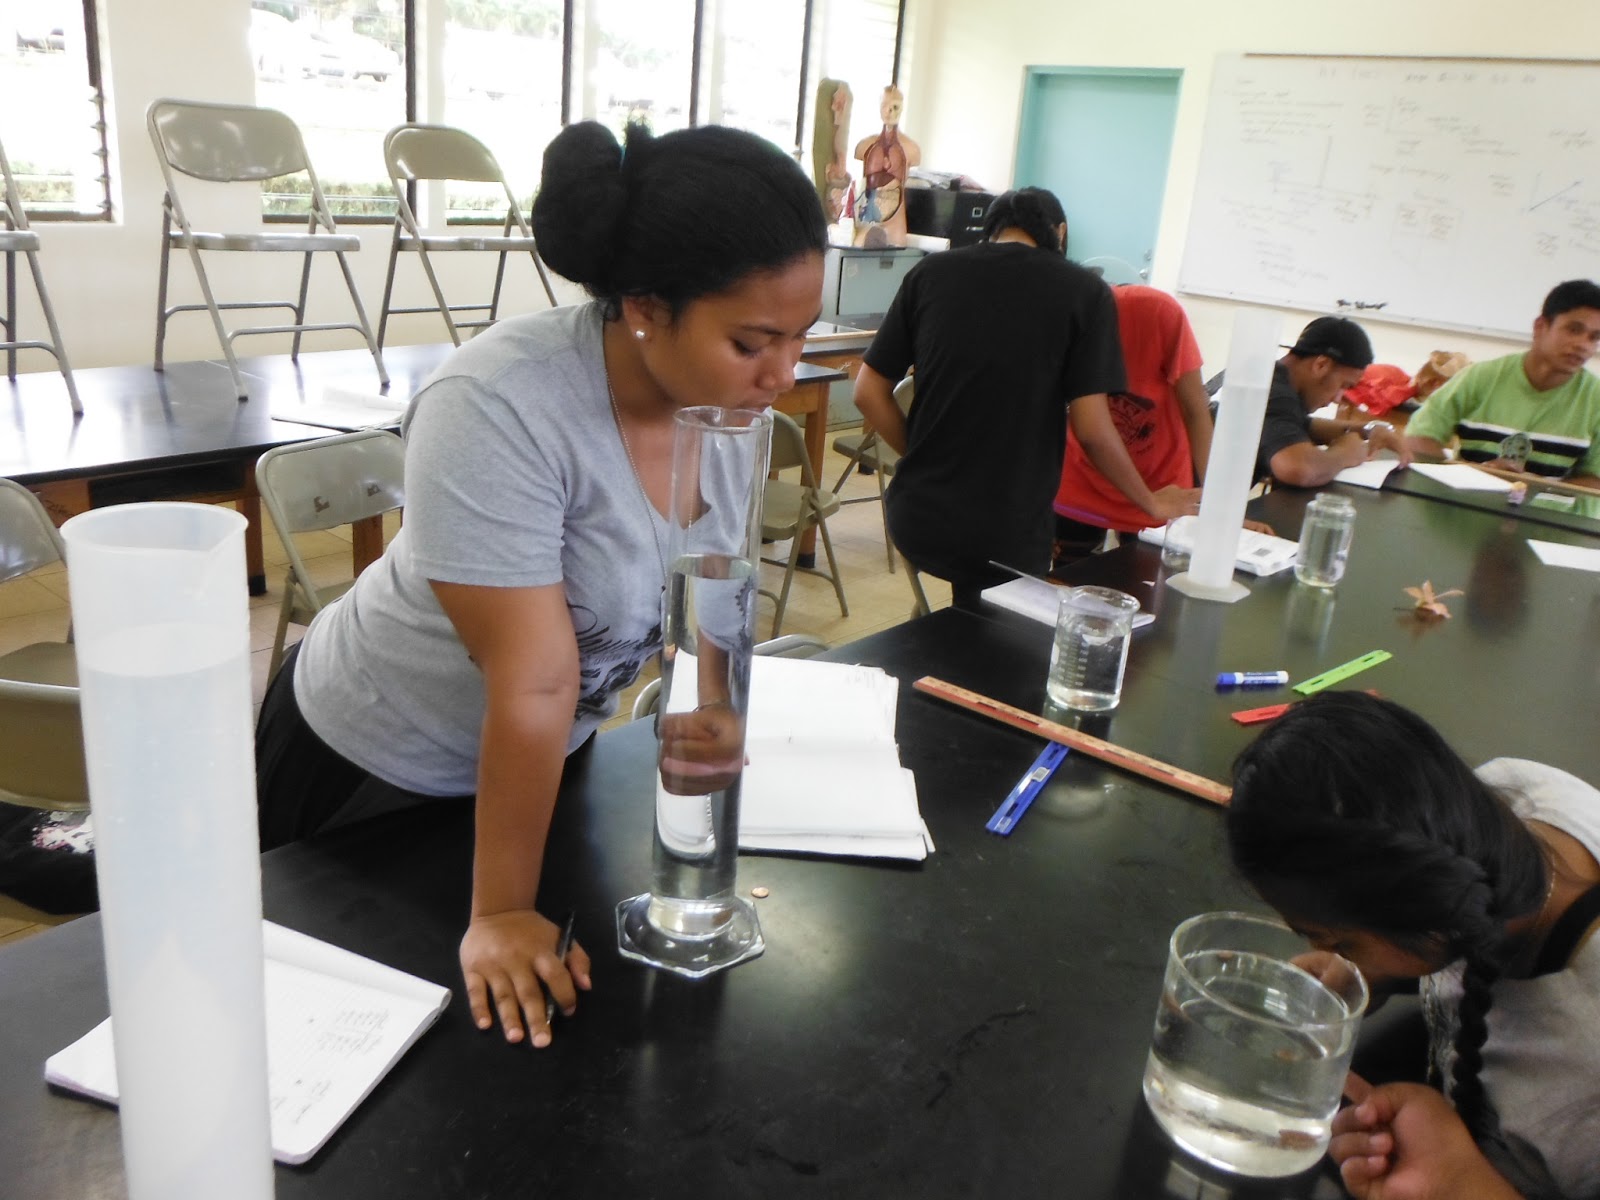
Dalynda makes a visual assessment of the apparent depth of a penny
Week ten ended with a third Friday of no classes. Liberation day back in December, a staff development day in early October, and now UN day observed all landing on Friday.

Petery observes the apparent depth of a penny
Week eleven should have started with the Light and Optics video, but some students were excused as part of a forum involving Pohnpei state. The vast majority of my students this term are Pohnpei state residents, the forum had value for them as well. The forum, was, quite frankly, a historic first and were I Pohnpei state student I would certainly have skipped class to go to the forum. College is not just about what happens inside the classroom or on the campus outside the classroom. College is also a time of maturing into a socially and politically aware adult.

Ioakim and Renster compare data, Jamie Barnabas in the background taking notes
This pushed the video to Wednesday and added some material to the reflection and refraction lab on Thursday.

Ioakim Walter estimates the apparent position of the penny, Renster measures the actual position.
The laboratory is simple in design. This is in part to prevent trigonometric mathematics (which only a few students in the class have been exposed to) from obscuring the science. With time, effort, and resources I could use lasers and protractors to measure the sine of the angles involved in refraction. The math, however, would turn the laboratory into a mysterious black box, meaningless values for the students. Newton mastered the mathematics of trigonometry first, and then apparently perceived his world through the lens of that mathematics. He saw a mathematically driven world, but he already had much of the mathematics on board.

Regina, Mary-Ann, Dalynda
This laboratory measures the actual depth of a penny and the apparent depth. The ratio is an estimate of the index of refraction of light for water. Different depths provide different data points, that leads to a linear regression, a linear model, and the class is right back on the familiar ground of a linear regression. Think of the course as something like sixteen weeks of y = mx + b. The hope is that linear equation will become familiar terrain, a cognitive hook upon which the students can hang future ideas and understandings. If the class really connects, then they will see linear relationships in the world around them long after the class ends. They will watch their kid ride a skateboard and know that a linear regression is underneath that motion in time and space. Bearing in mind most students in the course are not science majors, that way of seeing the world would not be expected of them. Yet being able to access and apprehend that understanding of the world has intrinsic value in this day and age of science and technology. Is global warming linear or non-linear? These students of the islands may have a better idea of what is being discussed in that sentence.

Regina and Sharisey
While I note that the ratio of the actual depth to the apparent depth - the slope of the line - is the refraction of water, I do not tell the students the value. That they have look up.

Macksy Daniel, Jamie, Mary-Ann, Marcyliza
I also do not explain what the relationship should be between the object distance and image distance for the reflection portion of this laboratory. I let the students propose a relationship. Every term someone suggests that the two distances could be equal. I then name the hypothesis using their last name, or if two people jump to it together, I hyphenate the hypothesis. This term we had the Walter-Daniel theory, which Daniel then dutifully set up disproving.

Sahn lines up a kangaroo
In the afternoon we had the Billen hypothesis that the slope would be equal to one and the Gilmete hypothesis that the slope would be greater than one - the object distance would exceed the image distance.

Ryan Kuor works on the image location
Ryan and Sahn had data that appeared to be problematic - image distances for reflection varying almost randomly. I was unable to determine how they had arrived at the data they had already gathered. I do not, however, make a habit of telling the students that what they have measured is wrong. I might point out that the data is not congruent to what other students are finding. The spirit of the class is in keeping with the The Royal Society of London's motto, 'Nullius in verba.' "'Nullius in verba' is taken to mean 'take nobody's word for it'. It is an expression of the determination of Fellows to withstand the domination of authority and to verify all statements by an appeal to facts determined by experiment." They did the experiment, they have their data, my disputing that data would be asking them to take my word over their data. The students had already been warned at the start of the term to heed William Gilbert's advice, "handle the bodies carefully, skilfully, and deftly, not heedlessly and bunglingly." Take no one's word for it, but measure carefully. Repeatedly.

Sahn records data
Final conclusions on the status of the hypotheses will not be known until the laboratory reports are written up. These are no cookbook style laboratories, these are each written up as a report.

Erika Emily Billen and Casan-Jenae Joab test the Billen hypothesis

Everashia Helter and Meagan Jonathan opted to use a marker as their object

Meagan makes measurements

Jonnie Gilmete tests her theorem with the assistance of Seloma Waltu

Adelma John and Stephanie Alexander

Marvin Louis and Monaliza Mauricio

Leionna Edgar and Patty Mario

Justacia Kanichy and Erika Emily

Jonnie continues to work on data she hopes will confirm her theory

Casan-Jenae and Justacia


Comments
Post a Comment