Rolling kick balls and linear relationships
I began the unit on linear velocity using the RipStik to generate a time versus distance relationship.

After I gather the data, the class copies the data. Although having a student ride the RipStik could shift the demonstration to a participation exercise, no student has had the ability to ride stably to date.

Laboratory two built off of the graphs I put on the board on Wednesday. The class sought to validate the predictions I had made on the white board.

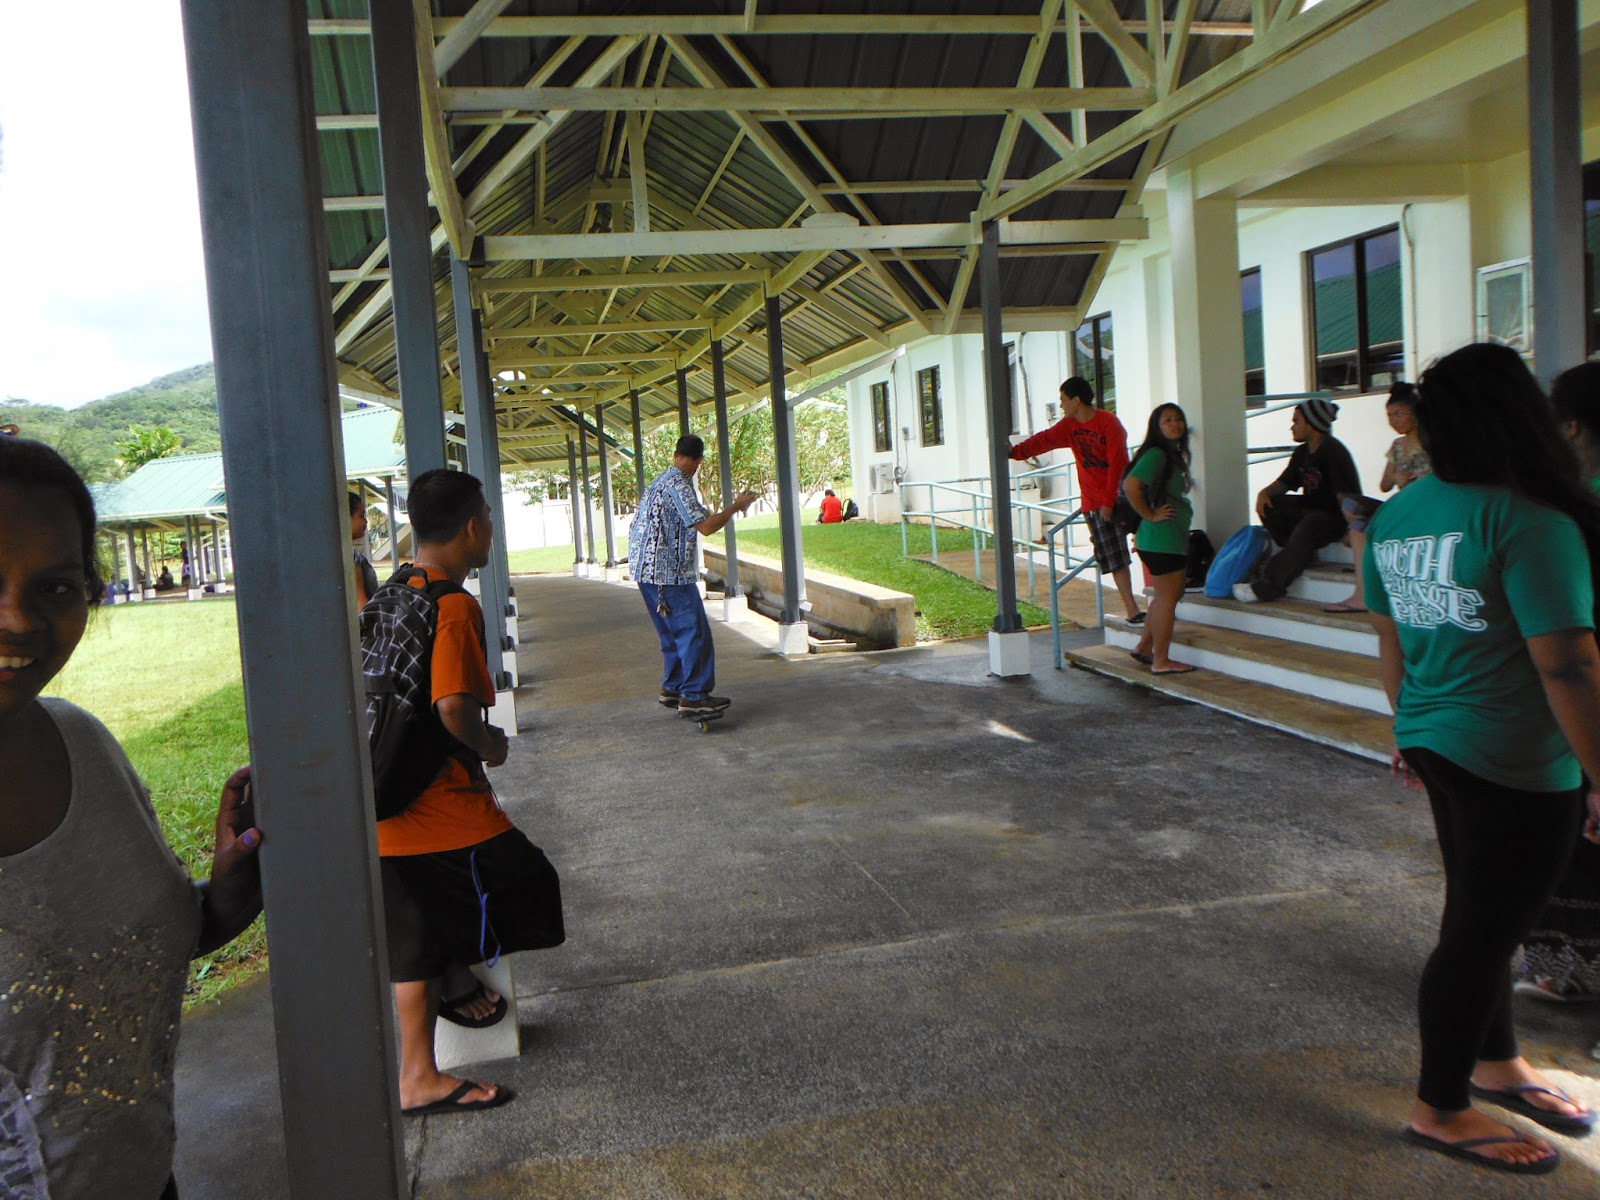
A view down the walkway. In the afternoon I shifted the slower balls to the east where the slight slope offsets the frictional velocity losses.
 The highest speed ball was an air ball.

Vancyleen recording data.

In the afternoon the launch point was moved to the east as seen above to get a steady slow speed ball roll.

As the speed increased, I backed the pitcher up the sidewalk to the west. Due to the geometry of the sidewalk and slight slope, this worked rather well, better than launching all balls from the exact same spot.

After I gather the data, the class copies the data. Although having a student ride the RipStik could shift the demonstration to a participation exercise, no student has had the ability to ride stably to date.
Laboratory two built off of the graphs I put on the board on Wednesday. The class sought to validate the predictions I had made on the white board.
A view down the walkway. In the afternoon I shifted the slower balls to the east where the slight slope offsets the frictional velocity losses.
Vancyleen recording data.
In the afternoon the launch point was moved to the east as seen above to get a steady slow speed ball roll.
As the speed increased, I backed the pitcher up the sidewalk to the west. Due to the geometry of the sidewalk and slight slope, this worked rather well, better than launching all balls from the exact same spot.


Comments
Post a Comment