Course Completion Rates
At the campus wide meeting on 23 October an administrator noted a number
of contributing factors to the revenues falling short of
projections. There are enrollment factors, average credit load
decreases, reduced retention, and a drop in course completion
rates among other factors. The latter most piqued my interest. My
focus has been on producing and assessing learning. I stepped down
as division chair in 2007 in part in order to pursue classroom
level assessment of learning. I have produced both college reports
assessing learning and a number of other reports on learning in my
classrooms.
I understood as I worked on assessment that learning was the core. Grades do not measure learning outcomes achieved. And while budgets are to be driven by learning, the metrics that were mentioned in the meeting and which have been discussed in other venues are enrollment, head counts, FTEs, retention rates, and course completion rates. Some courses have even been targeted for low completion rates. This is the reality, income derives from those metrics and not learning metrics. While I could not produce information on enrollment, FTEs, or retention, I knew I could generate data on course completion.
A number of questions concerned me. Was the downward trend seen in the chart Spring 2010-2013 Course Completion on page five of the Spring 2013 Enrollment and Achievement report also reflected in my courses? Was that downward trend unusual or were such trends down or up often seen? What kind of variation in course completion rates can be expected over time? Is any one term predictive of the next term? How do my courses impact college course completion rates? How do my course completion rates compare to college rates? More bluntly, are my classes part of the course completion rate problem or solution?
I knew I had access to long term data in three courses. MS 150 Statistics data stretched back to fall 2000 when I took over a single anemic section of statistics. The course had only 23 students in the fall 2000 class. I was only aware that the course completion rate had been abysmal according to Dr. Calvin Burgoyne and Dr. Mac MacCarter in the mid-1990s. I was unsure of the course completion rate under the tenure of John Gann. The class was certainly not "popular" by any stretch of the imagination.

Enrollment in MS 150 has climbed over the past thirteen years. By fall 2001 a second section was added to meet demand. The following spring the course returned to having only a single section, but demand was too great and the second section returned permanently in fall 2002. As instructor I worked to ensure the course met the needs of the programs for which the course was important. In fall 2009 demand led to the addition of a third section. Although only two sections were originally offered for fall 2013, demand led to the addition of a third section. The third section would see 29 of 30 seats filled. Where the course only ever ran a single section in the 1990s, under my tenure the course has expanded to handle as many as 89 students. My familiarity with the subject matter, understanding of my students, and the judicious use of technology have permitted me to handle the expanded enrollment.

Course completion data for MS 150 over the past twelve years was analyzed both for the ABC and ABCD completion rate. Only the fall and spring terms were analyzed. Summer term performance is known to be stronger for all courses, and college data is also based on fall and spring term data. Data for withdrawals was recorded for only six of the 24 terms prior to fall 2012 when MyShark data provided withdrawal counts. Withdrawals averaged three per term in the six terms prior to fall 2012, 3.7 for fall 2012 onwards. This suggests that the withdrawal rate has remained small and would not significantly decrease the course completion rates.
The strong drop in the ABC rate in fall 2007 coincided with the course shifting to the use of open book tests. As I note to the students, no one takes away my books and then asks me to do statistics. Closed book assessment is not authentic assessment. I expected the shift to open book tests would lead to higher grades. On the contrary, the shift to open book tests was accompanied by students studying less. The tests, however, had become more difficult - I now expected that the students would know the easy material such as mean, median, and mode, and would only have to look up the more complex material.
The MS 150 course completion data provides some of the first answers to my original questions. Trends can continue for three or four terms, only to then reverse and trend in the other direction. Data will almost always tend to the return to the long term mean. Variation term-to-term can be large even when no curricular or section number variables are changing. Spring 2005 saw 59 students achieve an 0.83 ABC rate. Fall 2005 60 students obtained only a 0.68, a fall of 15 percentage points. One term does not well predict the next term or the length of the trend that is running at that time.
While MS 150 Statistics represents the longest data run with 1449 grades over 26 terms, SC 130 Physical Science also provides some insight with 444 grades over 13 terms. My first contact with SC 130 was actually back in the spring of 2000. An instructor left at midterm and I picked up the class. At midterm 39% of the class was failing, 22% had a D, and the remaining 39% had an ABC. By term's end I had lifted learning and grades in the course. 79% would pass with an ABCD, with 67% having an ABC. Although I would not again handle this course until fall 2007, I include the spring 2000 data as an indication that a course with a low course completion rate can be turned around by a capable and experienced instructor.
Again the term-to-term variability can clearly be large. A trend might hold for only two or three terms. Given that the sample size in SC 130 is smaller than MS 150, the variability in the SC 130 data could be expected to be larger. Smaller samples will exhibit larger variations from sample to sample than will be seen in large samples. The ABC drop between spring 2010 and fall 2010 while visually large, is reflective of the variability in a small sample size. Spring 2011 can be seen as a return to and just above the longer term mean of 62%. The most recent three term climb in the ABC rate that began in spring 2012 is actually a return to the mean. The spring 2013 ABC rate is almost exactly at the mean value seen since fall 2010. Note that the ABCD rate actually slipped in spring 2013. Terms and trends predict little other than the general trend of the data to return to a long term mean.
How do my course completion rates compare for my courses to the college wide course completion rates? A table in the report Spring 2013 Enrollment and Achievement provides comparison data for four spring terms. For my own rates I used all courses I taught in each of those spring terms.

My rates have remained above college rates, although spring 2013 saw my ABC rate drop down closer to the college wide ABC rate. Prior to spring 2013 my ABC rate was above the college wide ABCD rate. Spring 2013 did see a change in the grading system in MS 150 that was a result of my first use of an on line grade book. The negative impact of Engrade on course performance scores was reported in a blog article last May. The 89 students in MS 150 represented 61% of my students spring 2013, thus a drop in statistics has a strong impact on overall course completion for the term.
Course completion rates will vary from course-to-course and a college must expect some courses to naturally be more difficult and have lower course completion rates. That said, course completion rates are a key component of retention and graduation rates. Course completion with an ABC is also necessary to remain in good academic standing and financial aid eligible. The vast majority of the students require financial assistance, grades of ABC are necessary to their remaining in college. Ultimately, revenue is improved by higher course completion rates, and in recognition of this the college has targeted for additional learning support some underperforming courses with ABC course completion rates below 30%. The difficulty is in determining whether a course is underperforming or whether the material is of a nature that yields low course completion rates.
I had the opportunity last fall to handle a course which has apparently underperformed college averages consistently term-on-term. I gather that the course is among those targeted for improved performance.

Although the material can be challenging, taught in an engaging and interactive manner the course saw real gains in learning as well as in course completion rates. The ABC rate was 64% and the ABCD rate was 80%. Failures fell to 20% (5 of 25 students). As I did not get the chance to teach the course again, I did not have the length of tenure required to modify the course to improve learning. I feel confident that while there will be term-to-term variability, those numbers can be improved. A trend line analysis for both MS 150 and SC 130 show an improvement of 0.4% (less than half a percent) per term in the ABC rates, providing some support to the concept that despite the variability, experience can improve course completion rates.
Grades do not measure learning and improvement in course completion rates must never occur without learning also improving. I spend more of my time working on assessing learning with the hope that the course completion rates will be supported by that learning. Numerous reports via email, a college page of links to assessment materials, and 71 assessment articles since 2008 are part of the work I have done on assessing learning. The college is charged with ensuring that resources, including faculty, are deployed based on learning. I cannot prove a linkage between course completion and learning, but as I noted in December 2005, I have confidence that "qualified faculty implementing outlines based on student learning outcomes produce trustworthy grades." I have confidence that my grades are a trustworthy reflection of learning.
I understood as I worked on assessment that learning was the core. Grades do not measure learning outcomes achieved. And while budgets are to be driven by learning, the metrics that were mentioned in the meeting and which have been discussed in other venues are enrollment, head counts, FTEs, retention rates, and course completion rates. Some courses have even been targeted for low completion rates. This is the reality, income derives from those metrics and not learning metrics. While I could not produce information on enrollment, FTEs, or retention, I knew I could generate data on course completion.
A number of questions concerned me. Was the downward trend seen in the chart Spring 2010-2013 Course Completion on page five of the Spring 2013 Enrollment and Achievement report also reflected in my courses? Was that downward trend unusual or were such trends down or up often seen? What kind of variation in course completion rates can be expected over time? Is any one term predictive of the next term? How do my courses impact college course completion rates? How do my course completion rates compare to college rates? More bluntly, are my classes part of the course completion rate problem or solution?
I knew I had access to long term data in three courses. MS 150 Statistics data stretched back to fall 2000 when I took over a single anemic section of statistics. The course had only 23 students in the fall 2000 class. I was only aware that the course completion rate had been abysmal according to Dr. Calvin Burgoyne and Dr. Mac MacCarter in the mid-1990s. I was unsure of the course completion rate under the tenure of John Gann. The class was certainly not "popular" by any stretch of the imagination.

Enrollment in MS 150 has climbed over the past thirteen years. By fall 2001 a second section was added to meet demand. The following spring the course returned to having only a single section, but demand was too great and the second section returned permanently in fall 2002. As instructor I worked to ensure the course met the needs of the programs for which the course was important. In fall 2009 demand led to the addition of a third section. Although only two sections were originally offered for fall 2013, demand led to the addition of a third section. The third section would see 29 of 30 seats filled. Where the course only ever ran a single section in the 1990s, under my tenure the course has expanded to handle as many as 89 students. My familiarity with the subject matter, understanding of my students, and the judicious use of technology have permitted me to handle the expanded enrollment.

Course completion data for MS 150 over the past twelve years was analyzed both for the ABC and ABCD completion rate. Only the fall and spring terms were analyzed. Summer term performance is known to be stronger for all courses, and college data is also based on fall and spring term data. Data for withdrawals was recorded for only six of the 24 terms prior to fall 2012 when MyShark data provided withdrawal counts. Withdrawals averaged three per term in the six terms prior to fall 2012, 3.7 for fall 2012 onwards. This suggests that the withdrawal rate has remained small and would not significantly decrease the course completion rates.
The strong drop in the ABC rate in fall 2007 coincided with the course shifting to the use of open book tests. As I note to the students, no one takes away my books and then asks me to do statistics. Closed book assessment is not authentic assessment. I expected the shift to open book tests would lead to higher grades. On the contrary, the shift to open book tests was accompanied by students studying less. The tests, however, had become more difficult - I now expected that the students would know the easy material such as mean, median, and mode, and would only have to look up the more complex material.
The MS 150 course completion data provides some of the first answers to my original questions. Trends can continue for three or four terms, only to then reverse and trend in the other direction. Data will almost always tend to the return to the long term mean. Variation term-to-term can be large even when no curricular or section number variables are changing. Spring 2005 saw 59 students achieve an 0.83 ABC rate. Fall 2005 60 students obtained only a 0.68, a fall of 15 percentage points. One term does not well predict the next term or the length of the trend that is running at that time.
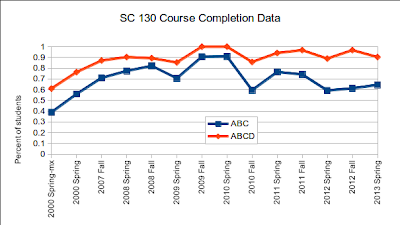
While MS 150 Statistics represents the longest data run with 1449 grades over 26 terms, SC 130 Physical Science also provides some insight with 444 grades over 13 terms. My first contact with SC 130 was actually back in the spring of 2000. An instructor left at midterm and I picked up the class. At midterm 39% of the class was failing, 22% had a D, and the remaining 39% had an ABC. By term's end I had lifted learning and grades in the course. 79% would pass with an ABCD, with 67% having an ABC. Although I would not again handle this course until fall 2007, I include the spring 2000 data as an indication that a course with a low course completion rate can be turned around by a capable and experienced instructor.

Again the term-to-term variability can clearly be large. A trend might hold for only two or three terms. Given that the sample size in SC 130 is smaller than MS 150, the variability in the SC 130 data could be expected to be larger. Smaller samples will exhibit larger variations from sample to sample than will be seen in large samples. The ABC drop between spring 2010 and fall 2010 while visually large, is reflective of the variability in a small sample size. Spring 2011 can be seen as a return to and just above the longer term mean of 62%. The most recent three term climb in the ABC rate that began in spring 2012 is actually a return to the mean. The spring 2013 ABC rate is almost exactly at the mean value seen since fall 2010. Note that the ABCD rate actually slipped in spring 2013. Terms and trends predict little other than the general trend of the data to return to a long term mean.
How do my course completion rates compare for my courses to the college wide course completion rates? A table in the report Spring 2013 Enrollment and Achievement provides comparison data for four spring terms. For my own rates I used all courses I taught in each of those spring terms.

My rates have remained above college rates, although spring 2013 saw my ABC rate drop down closer to the college wide ABC rate. Prior to spring 2013 my ABC rate was above the college wide ABCD rate. Spring 2013 did see a change in the grading system in MS 150 that was a result of my first use of an on line grade book. The negative impact of Engrade on course performance scores was reported in a blog article last May. The 89 students in MS 150 represented 61% of my students spring 2013, thus a drop in statistics has a strong impact on overall course completion for the term.
Course completion rates will vary from course-to-course and a college must expect some courses to naturally be more difficult and have lower course completion rates. That said, course completion rates are a key component of retention and graduation rates. Course completion with an ABC is also necessary to remain in good academic standing and financial aid eligible. The vast majority of the students require financial assistance, grades of ABC are necessary to their remaining in college. Ultimately, revenue is improved by higher course completion rates, and in recognition of this the college has targeted for additional learning support some underperforming courses with ABC course completion rates below 30%. The difficulty is in determining whether a course is underperforming or whether the material is of a nature that yields low course completion rates.
I had the opportunity last fall to handle a course which has apparently underperformed college averages consistently term-on-term. I gather that the course is among those targeted for improved performance.

Although the material can be challenging, taught in an engaging and interactive manner the course saw real gains in learning as well as in course completion rates. The ABC rate was 64% and the ABCD rate was 80%. Failures fell to 20% (5 of 25 students). As I did not get the chance to teach the course again, I did not have the length of tenure required to modify the course to improve learning. I feel confident that while there will be term-to-term variability, those numbers can be improved. A trend line analysis for both MS 150 and SC 130 show an improvement of 0.4% (less than half a percent) per term in the ABC rates, providing some support to the concept that despite the variability, experience can improve course completion rates.
Grades do not measure learning and improvement in course completion rates must never occur without learning also improving. I spend more of my time working on assessing learning with the hope that the course completion rates will be supported by that learning. Numerous reports via email, a college page of links to assessment materials, and 71 assessment articles since 2008 are part of the work I have done on assessing learning. The college is charged with ensuring that resources, including faculty, are deployed based on learning. I cannot prove a linkage between course completion and learning, but as I noted in December 2005, I have confidence that "qualified faculty implementing outlines based on student learning outcomes produce trustworthy grades." I have confidence that my grades are a trustworthy reflection of learning.


Comments
Post a Comment