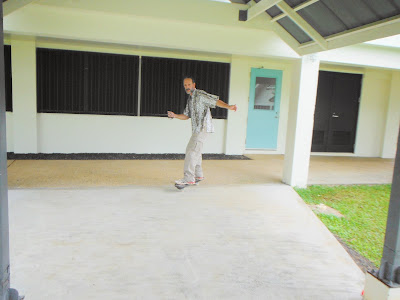
RipStik Linear

This term I started from the LRC and headed east. I measured each column using a tape measure. Zero was the first gray post just barely visible on the left.
| time (s) | distance (cm) | v (cm/s) | a (cm/s²) |
| 0 | 0 | 157 | 0 |
| 1.94 | 304 | 157 | 0 |
| 3.63 | 610 | 181 | 14.42 |
| 5.28 | 930 | 194 | 7.80 |
| 6.98 | 1232 | 178 | -9.58 |
| 8.60 | 1535 | 187 | 5.80 |
| 10.16 | 1842 | 197 | 6.26 |
| 11.72 | 2147 | 196 | -0.82 |
| 13.66 | 2454 | 158 | -19.21 |

There is a slight downslope at the start of the run, which gave me a very slight boost in velocity. The gain is only clearly visible in the data table. On a graph the data plots linear with a correlation coefficient r of 0.9997.

Plotting only the velocity and acceleration reveals the slight shifts in velocity.
The changes in velocity are small enough that they are difficult to discern in the time versus distance velocity chart.
At other locations I have taken the interpost spacing to be constant, but in this case the fourth post is a little long. The following table records the post-to-post distances. Not including the 320 cm interpost distance, the average is 305 centimeters - essentially exactly ten feet.
| Interpost |
| 304 |
| 306 |
| 320 |
| 302 |
| 303 |
| 307 |
| 305 |
| 307 |


Comments
Post a Comment