MS 150 statistics midterm assessment
Eighty students took the spring 2012 midterm examination. Scores ranged from a low of nine to a high score of 34. The mode was 21, the median 23, and the average was 22.44. This represents a 66% success rate.
Performance was lower in the eight o'clock class with an average of 16.96. A histogram of the student score distribution makes clear the difference in the two sections. The eight o'clock section has been under performing the 9:00 and 10:00 sections due to a higher rate of absences and late arrivals to class.
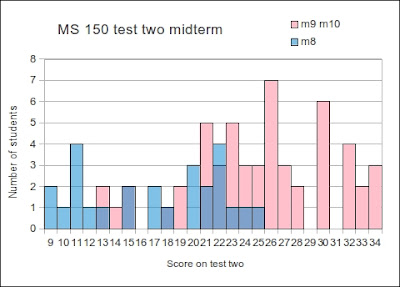
The blue columns represent 8:00 student scores, the pink represent 9:00 and 10:00 scores. Note that the highest score attained at 8:00 was 25, well below the 34 attained by three students in the other two sections. There were 35 possible points on the midterm examination.
The low score in the 8:00 section was nine, no student at 9:00 or 10:00 scored below 13.

An item analysis was done on the midterm with the results shown above. Student performance was strongest on basic statistical calculations and the use of functions to obtain answers. Students had difficulties with the frequency table, histogram, probability calculations, and using linear regressions to predict values.
An assessment was done against the program and course level student learning outcomes. The percentages are the average success rate against the listed outcome. The program learning outcomes (plo) 3.1 and 3.2 are listed horizontally. The course learning outcomes (clo 1 and 2) are listed vertically with the individual learning outcomes (slo) also presented.
As noted above, weak performance was seen on SLOs 1.2, 1.4, and 3.3.
| Average - perc | plo | |||
| clo | slo | 3.1 Demonstrate understanding and apply mathematical concepts in problem solving and in day-to-day activities | 3.2 Present and interpret numeric information in graphic forms. | Average |
| 1 Perform basic statistical calculations | 1.1 Identify levels of measurement and appropriate statistical measures for a given level of measurement | 0.63 | 0.63 | |
| 1.2 Determine frequencies and relative frequencies, create histograms and identify their shape visually. | 0.48 | 0.74 | 0.65 | |
| 1.3 Calculate basic statistical measures of the middle, spread, and relative standing. | 0.82 | 0.82 | ||
| 1.4 Calculate simple probabilities for equally likely outcomes. | 0.29 | 0.29 | ||
| 1 Average | 0.55 | 0.74 | 0.60 | |
| 3 Perform linear regressions | 3.1 Calculate the linear slope and intercept for a set of data | 0.69 | 0.69 | |
| 3.2 Calculate the correlation coefficient r | 0.60 | 0.60 | ||
| 3.3 Generate predicted values based on the regression | 0.26 | 0.26 | ||
| 3 Average | 0.43 | 0.69 | 0.52 | |
| Overall average | 0.52 | 0.74 | 0.55 | |


Comments
Post a Comment