Hooke, Heat, Latitude and Longitude
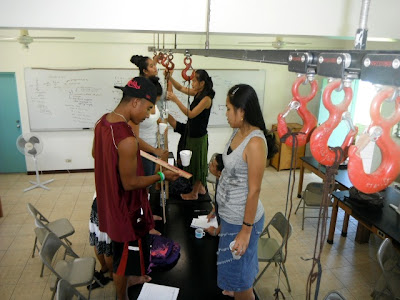
Laboratory 52 investigated Hooke's Law using readily available local materials, styrofoam cups, marbles, and elastic bands. This laboratory substitutes the traditional springs and masses, both of which are unavailable in the local schools, with elastic and marbles. I note to the students that if they have no mass balance, and no public school does out here as far as I now, just use five grams per marble. Essentially one is measuring in marble units.

The elastic is common dress elastic, attached via lengths of string or yarn to overhead hooks. Noting that schools also lack meter sticks, I recommend dropping the cup lower and using rules. Typical cup descents are less than 30 cm.
This spring the students massed all thirty marbles at one time. All thirty marbles fit in the mass balance pan. As I did last spring, I had the students round to the nearest whole gram that was a multiple of three. Dividing by thirty marbles left only a single decimal place and no repeating decimals.

Fall 2010 the divided answer had been round to the nearest tenth, this does the same thing but handles the rounding beforehand. I also used this opportunity to teach/reteach the rule that one can add the digits to find a multiple of three.
Most of the sets of thirty marbles massed between 150 grams and 160 grams. Thus a 152 gram set of thirty was rounded to 153 grams prior to dividing by thirty. The resulting errors are small and are, quite frankly, dwarfed by measurement errors.
The above process, first used fall 2010, removed the need to mass each marble individually, which had been time consuming and interrupted the process of observing the elastic stretch. Small differences in marble mass were not significantly affecting the data.
The elastic is behaves in a somewhat complex manner that may vary with the length - not all of the elastic pieces are equal in length. Some students obtain a relatively linear graph, others a clearly bilinear graph, some a cube root-like trilinear, and some obtain a logarithmic graph.
This provides fertile ground for discussions with groups of their data, although this is generally only possible with groups that have a lap top with which to chart the data. Hand drawn graphs rarely capture the subtle S curves that are often encountered in the this laboratory.
This term 052 is only the third lab that gets handed in, and the first lab that does not feature a post-lab session upstairs.
Unlike spring 2011, I returned to thermal conductivity this fall for laboratory 62. The class viewed the cartoon video on temperature and heat on Monday, followed by coverage of temperature scales on Wednesday.
 Moses sops up water from a leaking rig.

Waiting for the heat to conduct...
Between periods I put up the 8:00 data. I had demonstrated tracking time versus temperature rise, all of the students followed that lead and tracked time versus temperature. Although the students chose their own time intervals, I attempted to standardize on two minute intervals.

I then asked the 11:00 class to do as is often done in science: confirm and extend the data set started by the 8:00 class.

The complication with this approach was serious data overload. Many wound up with time versus temperature charts with all of the materials. As a class we never had the time to get back at the data and really examine ways to simplify the charts. I did spend some time on Friday pulling together the threads for the week.
The 11:00 class was tasked on that Thursday evening with producing a preliminary chart for me to share with the class on Friday. This assignment actually worked.

The time data led naturally to a science reasoning question on the Friday quiz.
Laboratory 072 included as a back drop the still under construction covered walkways at the campus. Hide and seek arrived without my having conceived of anywhere in particular to hide, so I returned to the spot I used last spring. While that proved tough last spring, this term the first group found me at 12:08, with a second group not more than two minutes behind.
Both groups locked onto the latitude and then simply walked the longitude until they found me. Neither group was put off by the track taking them into the tall grass. I guess by now the students are vaguely aware that I hide deep in the grass.

Lisa Lollaine studies her GPS bearings with Yoleen also tracking along the same line of longitude.

Mindira with Gorang in the background.

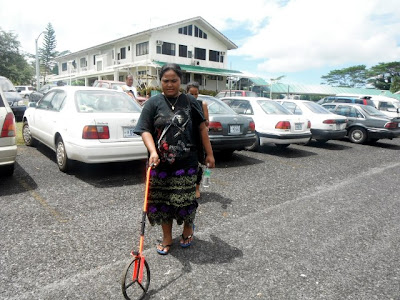
Connie handles the surveyor's wheel.

Jonnie reaches the end point on the longitude walk. The data from the above 11:00 class measurements came in at 2024 meters per minute, circumpolar.

With the end of class, weather moves in off the ridge line to the east of campus. Perfect timing.

The elastic is common dress elastic, attached via lengths of string or yarn to overhead hooks. Noting that schools also lack meter sticks, I recommend dropping the cup lower and using rules. Typical cup descents are less than 30 cm.

This spring the students massed all thirty marbles at one time. All thirty marbles fit in the mass balance pan. As I did last spring, I had the students round to the nearest whole gram that was a multiple of three. Dividing by thirty marbles left only a single decimal place and no repeating decimals.

Fall 2010 the divided answer had been round to the nearest tenth, this does the same thing but handles the rounding beforehand. I also used this opportunity to teach/reteach the rule that one can add the digits to find a multiple of three.
Most of the sets of thirty marbles massed between 150 grams and 160 grams. Thus a 152 gram set of thirty was rounded to 153 grams prior to dividing by thirty. The resulting errors are small and are, quite frankly, dwarfed by measurement errors.
The above process, first used fall 2010, removed the need to mass each marble individually, which had been time consuming and interrupted the process of observing the elastic stretch. Small differences in marble mass were not significantly affecting the data.
The elastic is behaves in a somewhat complex manner that may vary with the length - not all of the elastic pieces are equal in length. Some students obtain a relatively linear graph, others a clearly bilinear graph, some a cube root-like trilinear, and some obtain a logarithmic graph.
This provides fertile ground for discussions with groups of their data, although this is generally only possible with groups that have a lap top with which to chart the data. Hand drawn graphs rarely capture the subtle S curves that are often encountered in the this laboratory.
This term 052 is only the third lab that gets handed in, and the first lab that does not feature a post-lab session upstairs.
Unlike spring 2011, I returned to thermal conductivity this fall for laboratory 62. The class viewed the cartoon video on temperature and heat on Monday, followed by coverage of temperature scales on Wednesday.


Waiting for the heat to conduct...
Between periods I put up the 8:00 data. I had demonstrated tracking time versus temperature rise, all of the students followed that lead and tracked time versus temperature. Although the students chose their own time intervals, I attempted to standardize on two minute intervals.

I then asked the 11:00 class to do as is often done in science: confirm and extend the data set started by the 8:00 class.

The complication with this approach was serious data overload. Many wound up with time versus temperature charts with all of the materials. As a class we never had the time to get back at the data and really examine ways to simplify the charts. I did spend some time on Friday pulling together the threads for the week.
The 11:00 class was tasked on that Thursday evening with producing a preliminary chart for me to share with the class on Friday. This assignment actually worked.

The time data led naturally to a science reasoning question on the Friday quiz.
Laboratory 072 included as a back drop the still under construction covered walkways at the campus. Hide and seek arrived without my having conceived of anywhere in particular to hide, so I returned to the spot I used last spring. While that proved tough last spring, this term the first group found me at 12:08, with a second group not more than two minutes behind.
Both groups locked onto the latitude and then simply walked the longitude until they found me. Neither group was put off by the track taking them into the tall grass. I guess by now the students are vaguely aware that I hide deep in the grass.
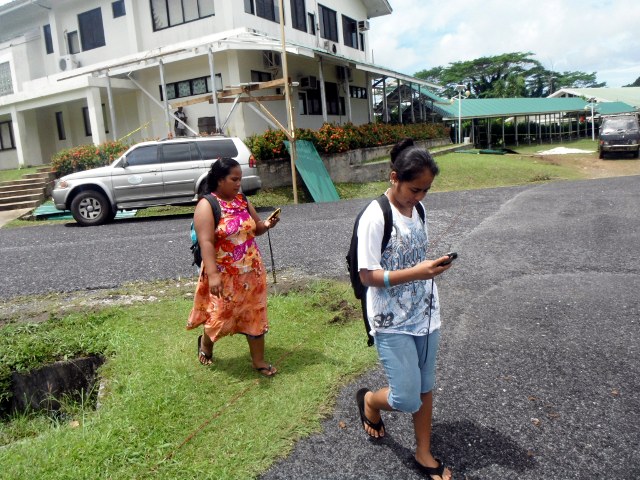
Lisa Lollaine studies her GPS bearings with Yoleen also tracking along the same line of longitude.

Mindira with Gorang in the background.

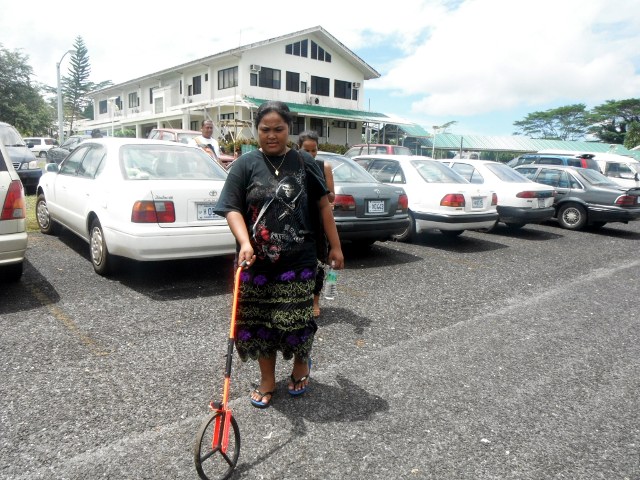
Connie handles the surveyor's wheel.

Jonnie reaches the end point on the longitude walk. The data from the above 11:00 class measurements came in at 2024 meters per minute, circumpolar.

With the end of class, weather moves in off the ridge line to the east of campus. Perfect timing.


Comments
Post a Comment