An unofficial look at high school performance in the FSM on the COMET
I recently received a copy of a preliminary report on the entrance test administered here at the college. While not all high schools were tested, and the data remains preliminary and tentative, the tables in the report once again provide insight into the relative performance of the high schools in the FSM.
The report consists of pages of tables filled with numbers. Being a visual learner, I decided to cobble together some charts. As I did not have access to the original data, my charts are only rough indications of the approximate rank order. While the rank order is thought to be roughly correct - the same data transformations were applied to all schools, the actual y-axis values are not likely to be correct.
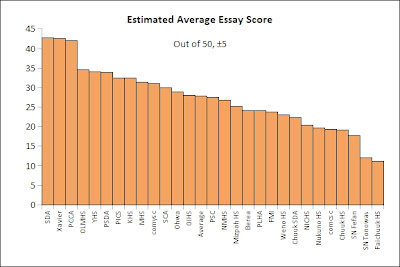 The essay score averages were reconstructed from classed data and as such represent only a rough estimate of the mean essay score by high school.
 The reading grade level equivalent chart is the most problematic of the charts. The subtest is not designed to measure reading grade levels below seventh grade, although the interpolation tables for the subtest include reading grade levels below seventh grade. In addition, the frequency table from which I worked lumped together all students above the 9th grade reading level and all below the fifth grade reading level. This effectively artificially narrows the actual range of the scores.
Despite these multiple problems, the upshot of the data is that reading grade levels for the bulk of the high school students who sat the subtest remain below high school reading levels. This is not unusual given that the students are all ESL students working in English as an L2 language.
 The math test chart cannot be connected back to a meaningful y-axis as course placements were reported not scores. The course placements, however, can be used to construct an implied rank order for the school - a relative standing based on percentages placed in courses at different levels.
The report consists of pages of tables filled with numbers. Being a visual learner, I decided to cobble together some charts. As I did not have access to the original data, my charts are only rough indications of the approximate rank order. While the rank order is thought to be roughly correct - the same data transformations were applied to all schools, the actual y-axis values are not likely to be correct.


Despite these multiple problems, the upshot of the data is that reading grade levels for the bulk of the high school students who sat the subtest remain below high school reading levels. This is not unusual given that the students are all ESL students working in English as an L2 language.


Comments
Post a Comment