Acceleration of gravity
Laboratory 032 involves timing the fall of a ball to determine the acceleration of gravity g. The students drop a small superball from heights of 100 to 300 centimeters inside the classroom.

Laboratory 032 now builds on two earlier activities that during a regular school usually occur on Monday and Wednesday respectively. The first activity was a plot of time versus distance for an accelerating RipStik.

The students graphed the time versus the distance for the RipStik and found a non-linear relationship (curved line) between time and distance for the accelerating RipStik.

In the second activity, the arc of a ball, the students explored whether the trajectory of a ball might be related to a parabola. A quadratic equation was presented as the underlying mathematical relationship. The students graphed their data and the equation to explore whether the ball arc and the equation were related.

These two activities built into this laboratory where the specific mathematical relationship nature of time versus distance for a falling ball was measured.This term featured the approach of calculating ½t² for the second table and then graphing only the second table. This was also the first term to spend the second portion of the lab period in the computer laboratory. The lab was a solid, wall-to-wall three hours with no break.
Not graphing the first table left it unclear to the students that the data was inherently non-linear, but as in past terms, the first table was only visibly non-linear due to (0,0) and the 500 cm drop data point. The data from 100 to 300 has such a small amount of curvature as to appear linear given the errors. There also appears to a be a human penchant to increment the times linearily, although how this happens in practice escapes me as the students are reading their stopwatch times. My hunch is that the students are more likely to discard and then repeat a measurement that is not a linear step up in time.
Note that the summer approach of assigning teams to work at specific height was not deployed this term. Encouraging students to compare data between groups, and doing some comparison work myself, appeared to help correct timing errors. There were, however, as always, some groups that slipped past my attention and had serious timing errors in their data.
Also new this term was the use of WolframAlpha to determine the latitude and longitude of Pohnpei and then to use that data to determine the acceleration of gravity on Pohnpei. This value was then provided as the theoretic value against which to check the experimental value. My sense was that most of the students did not understand this portion of the exercise and that I will have to go back and cover percentage difference more carefully.


Sylvia holds a super ball while Caroline and Tracy Ann steady the meter sticks. Irene looks on.
Laboratory 032 now builds on two earlier activities that during a regular school usually occur on Monday and Wednesday respectively. The first activity was a plot of time versus distance for an accelerating RipStik.

Angie holds the meter sticks, Brilinda drops and times.
The students graphed the time versus the distance for the RipStik and found a non-linear relationship (curved line) between time and distance for the accelerating RipStik.

Jermis holds the tape measure as Fritzgerald releases the super ball.
In the second activity, the arc of a ball, the students explored whether the trajectory of a ball might be related to a parabola. A quadratic equation was presented as the underlying mathematical relationship. The students graphed their data and the equation to explore whether the ball arc and the equation were related.

These two activities built into this laboratory where the specific mathematical relationship nature of time versus distance for a falling ball was measured.This term featured the approach of calculating ½t² for the second table and then graphing only the second table. This was also the first term to spend the second portion of the lab period in the computer laboratory. The lab was a solid, wall-to-wall three hours with no break.

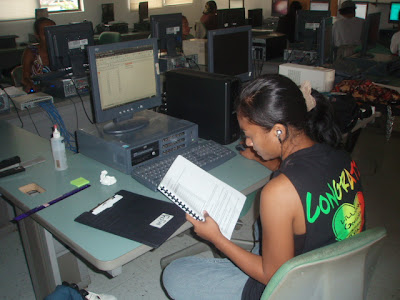
Antionette Ardos enters her data
Not graphing the first table left it unclear to the students that the data was inherently non-linear, but as in past terms, the first table was only visibly non-linear due to (0,0) and the 500 cm drop data point. The data from 100 to 300 has such a small amount of curvature as to appear linear given the errors. There also appears to a be a human penchant to increment the times linearily, although how this happens in practice escapes me as the students are reading their stopwatch times. My hunch is that the students are more likely to discard and then repeat a measurement that is not a linear step up in time.
Note that the summer approach of assigning teams to work at specific height was not deployed this term. Encouraging students to compare data between groups, and doing some comparison work myself, appeared to help correct timing errors. There were, however, as always, some groups that slipped past my attention and had serious timing errors in their data.
Also new this term was the use of WolframAlpha to determine the latitude and longitude of Pohnpei and then to use that data to determine the acceleration of gravity on Pohnpei. This value was then provided as the theoretic value against which to check the experimental value. My sense was that most of the students did not understand this portion of the exercise and that I will have to go back and cover percentage difference more carefully.

Kasinta and Ester wait for the ball to be dropped.


Comments
Post a Comment