Quadratic fit with Wolfram Alpha
In laboratory 03 the students gather time versus distance data for a falling ball. The data from three groups was average and is presented in the table below.
In the laboratory the students square the time to generate a linear regression, which is then used to determine the acceleration of gravity.
The WolframAlpha computational knowledge engine provides another option to this approach. Given a set of paired data, WolframAlpha will find the quadratic least-squares fit.
To get the data into the input format expected by WolframAlpha, I used OpenOffice.org setting up a table that included the brackets and a trailing space after the comma.
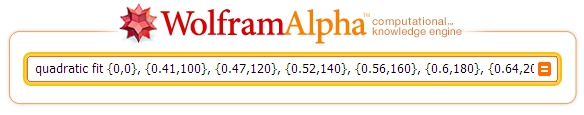
This was copied to Notepad++ where the extraneous tabs were deleted using a find and replace, along with an extended mode find and replace using \r\n to remove the carriage returns and new line feeds. This created a string that could be pasted into WolframAlpha:
 WolframAlpha then interpreted the input.
 After interpretation, WolframAlpha returned the least-squares fit for the quadratic relationship along with an output chart for the residuals (not shown).

| time (s) | distance (cm) |
| 0 | 0 |
| 0.41 | 100 |
| 0.47 | 120 |
| 0.52 | 140 |
| 0.56 | 160 |
| 0.6 | 180 |
| 0.64 | 200 |
| 0.69 | 220 |
| 0.73 | 240 |
| 0.77 | 260 |
| 0.83 | 280 |
| 0.84 | 300 |
| 0.9 | 400 |
| 0.95 | 500 |
In the laboratory the students square the time to generate a linear regression, which is then used to determine the acceleration of gravity.
The WolframAlpha computational knowledge engine provides another option to this approach. Given a set of paired data, WolframAlpha will find the quadratic least-squares fit.
To get the data into the input format expected by WolframAlpha, I used OpenOffice.org setting up a table that included the brackets and a trailing space after the comma.
| { | 0 | , | 0 | }, |
| { | 0.41 | , | 100 | }, |


Comments
Post a Comment