Heat conductivity of materials
Laboratory six intentionally uses the most trivial and basic materials in terms of equipment, only the thermometers would be problematic in a local elementary or secondary school.

Senioleen and Ceasar adjust their heat conductivity apparatus. The upper cup prevents convective heat loss.
In the first half of the laboratory the students work in pairs to measure the temperature rise in a cup of room temperature water connected to a cup with boiling water. Below a piece of basalt can be seen in a small amount of cool water. The covered cup contains hot water. The other cup rig has a marble between the cups, with holes in the cups exposing the marble to the hot water.

In the second half of the laboratory the student pairs team up to form groups of four students who then design a chart design to use to report their results. Every term the cool water cups start at slightly different temperatures, making a straight-forward column chart of the maximum temperatures an inaccurate reflection of overall temperature rise.

Leilani uses her subcompact computer to sketch out a chart design with the help of Merlisa and the others in her group. Three groups this term used laptop computers in the classroom.
 Elizabeth also used a computer to explore chart options.
The design intent is to give the students a chance to problem solve as a member of a team. This design mimics that of many conferences where the participants break up into small groups, propose solutions, and then present their solutions to the larger group.
 Adam works the keyboard as Angelo, Yvonne Sue, and Tellez look on. Each member contributed suggestions as their chart evolved on the computer.

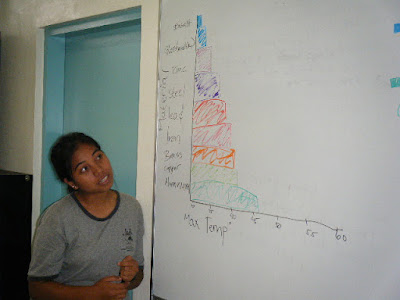
Yvonne Sue presents her groups proposed chart type to the class. Although communication skills are an institutional learning outcome, "teacher talk" time still dominates the student's classroom experience. Laboratory six provides an opportunity for students to present to a peer group and gain experience in standing up in front of a group.
 Each of the groups in the second half reports to the class on their chart design. This structure has worked exceedingly well the past couple of terms. The result is a wider variety chart designs and greater individual participation in the design process than when I had the class work as a whole on laying out a single chart design. There is also the benefit of providing an opportunity for students to engage in an impromptu presentation, a skill that is often called upon in this world of conferences and participative decision making.


Senioleen and Ceasar adjust their heat conductivity apparatus. The upper cup prevents convective heat loss.
In the first half of the laboratory the students work in pairs to measure the temperature rise in a cup of room temperature water connected to a cup with boiling water. Below a piece of basalt can be seen in a small amount of cool water. The covered cup contains hot water. The other cup rig has a marble between the cups, with holes in the cups exposing the marble to the hot water.

In the second half of the laboratory the student pairs team up to form groups of four students who then design a chart design to use to report their results. Every term the cool water cups start at slightly different temperatures, making a straight-forward column chart of the maximum temperatures an inaccurate reflection of overall temperature rise.

Leilani uses her subcompact computer to sketch out a chart design with the help of Merlisa and the others in her group. Three groups this term used laptop computers in the classroom.

The design intent is to give the students a chance to problem solve as a member of a team. This design mimics that of many conferences where the participants break up into small groups, propose solutions, and then present their solutions to the larger group.


Yvonne Sue presents her groups proposed chart type to the class. Although communication skills are an institutional learning outcome, "teacher talk" time still dominates the student's classroom experience. Laboratory six provides an opportunity for students to present to a peer group and gain experience in standing up in front of a group.


Comments
Post a Comment