Heart rate data in statistics class
The second student presentation in MS 150 Statistic occurs during the fourth week of the term. The presentation could theoretically use any set of data, the students are to use the statistics covered during weeks two and three in their presentations. During week two and and three measures of middle and spread were covered along with boxplots and histograms.
Fourth week in the fall term usually lands around Pohnpei liberation day marking the day control of the island passed from the Japanese to the Americans after world war two. Liberation day is a time of inter-municipal athletics. Baseball, softball, volleyball, basketball, table tennis, swimming, track and field.
This term is no exception with liberation day track and field events falling on Tuesday of the fourth week. In part as a result of this the presentation data has tried to center on a simple, easy to measure health metric, heart rate. The students first obtain their resting heart rate per minute by counting their pulse for 60 seconds. In past terms the students have then walk four laps of the building including stairs to raise their heart rate. This has never been much fun and has felt artificial. This term the idea of having the class go outside and throw around flying disks seemed like an option. Typhoon Mangkhut had just passed to the north of Pohnpei and left behind clear skies.

The class engaged in this activity with energy and vigor.

Then, using stopwatches, the students obtained their 60 second post-exercise pulse rate. The use of 60 seconds simplified the measurement, avoiding problems in the past with the use of 15 seconds and multiplying by four. By doing this measurement in the field, heart rates were still elevated up to 60 seconds post exercise.

The resulting anonymous data provides two sets of data for the students to explore along with the question of whether the amount of rise seen is a healthy level of increase for light to moderate exercise.
Fourth week in the fall term usually lands around Pohnpei liberation day marking the day control of the island passed from the Japanese to the Americans after world war two. Liberation day is a time of inter-municipal athletics. Baseball, softball, volleyball, basketball, table tennis, swimming, track and field.
This term is no exception with liberation day track and field events falling on Tuesday of the fourth week. In part as a result of this the presentation data has tried to center on a simple, easy to measure health metric, heart rate. The students first obtain their resting heart rate per minute by counting their pulse for 60 seconds. In past terms the students have then walk four laps of the building including stairs to raise their heart rate. This has never been much fun and has felt artificial. This term the idea of having the class go outside and throw around flying disks seemed like an option. Typhoon Mangkhut had just passed to the north of Pohnpei and left behind clear skies.

The class engaged in this activity with energy and vigor.
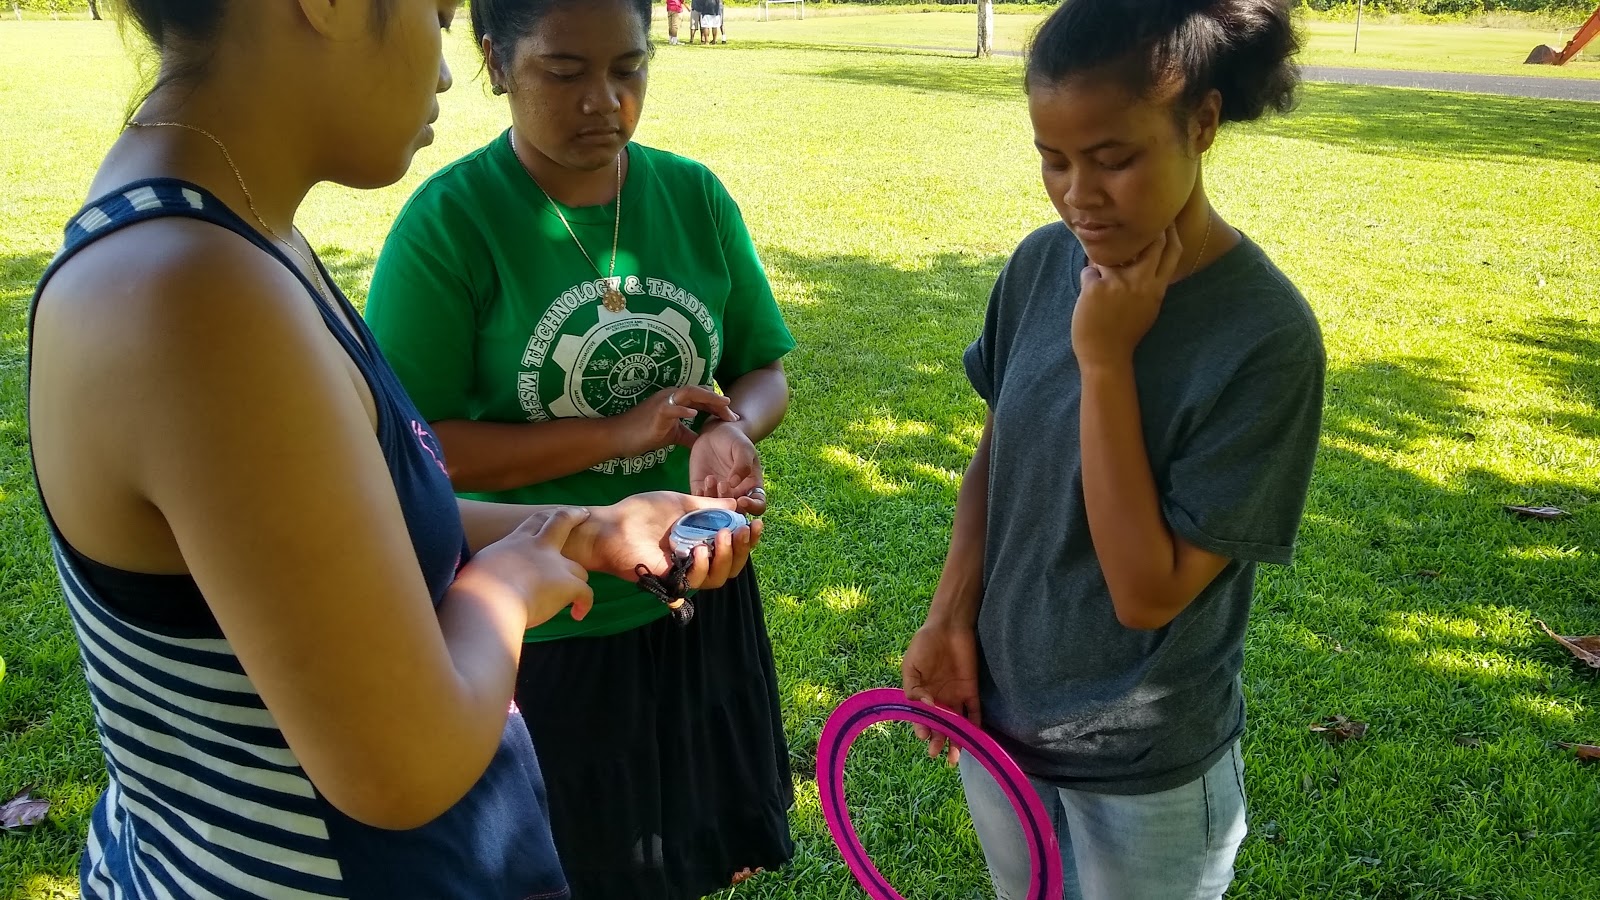
Then, using stopwatches, the students obtained their 60 second post-exercise pulse rate. The use of 60 seconds simplified the measurement, avoiding problems in the past with the use of 15 seconds and multiplying by four. By doing this measurement in the field, heart rates were still elevated up to 60 seconds post exercise.

The resulting anonymous data provides two sets of data for the students to explore along with the question of whether the amount of rise seen is a healthy level of increase for light to moderate exercise.


Comments
Post a Comment