Canvas analytics week two fall 2023
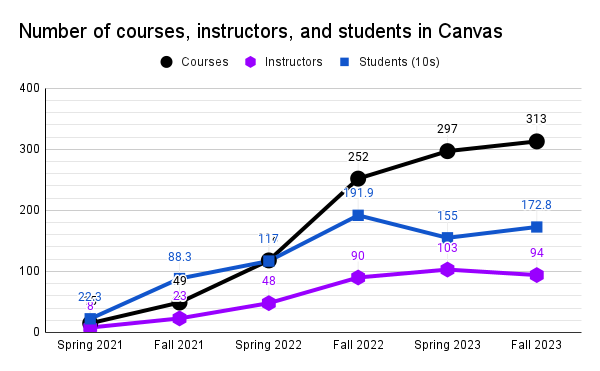
The number of courses, instructors, and students have increased since week one.
The increases are small, in part a result of course add/drop processes. The drop in the number of instructors may reflect in part vacancies that have developed and remain unfilled in a number of divisions across the system.Preliminary Canvas platform usage statistics.
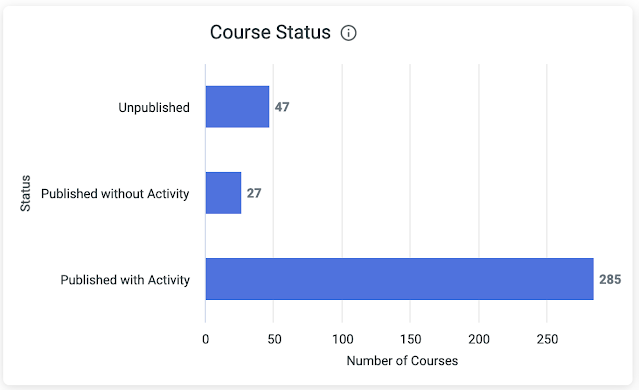
The unpublished courses still includes eleven courses with ten or more students listed as being enrolled. None of the published courses without activity have ten or more students. The highest enrollment for courses published without activity is seven students. These are likely to be courses that were cancelled due to low enrollment.
Displaying the campus with the highest median score in Canvas displays a different distribution. Looking at the chart the median of 100 might be puzzling, but the column of 106 scores on the right are null scores: these are students who do not yet have any score in their course in Canvas. Work done in the past suggested that by second week students are already on trajectories that lead to success or lack of success in a course. Getting early data on how students are doing is important to knowing where help is needed. Fourth week can be too late to intervene for some students, they simply never recover. So obtaining some early measurements of student performance is important to course completion and retention efforts.
Institutional dashboard
Systemwide the grade distribution is as is usually seen early in the term. The chart is displaying the number of scores in a particular score decade, not the number of students.
Displaying the campus with the lowest median score indicates a statistically normal distribution with a right tail, again, not unusual based on prior terms. Note that at this point all students on the Chuuk campus have a score, even if that score is zero.
Twenty-three course level student learning outcomes have already been measured in fourteen courses.
A prototype dashboard for disaggregation of institutional learning outcomes by student information system variables was updated. The prototype includes 269 students and uses the proposed five institutional learning outcomes. The dashboard is intended as a demonstration of concept. The data is actual data, the students are a non-random subset of the students fall 2023.
Page views are not available for week two at this time.


Comments
Post a Comment