Posts

Showing posts from June, 2020

MS 150 Statistics midterm quick look

Image
An installment in an ongoing set of reports on the first run of MS 150 Statistics online... Test three, the midterm, was made available to students at 5:00 PM on Thursday evening the 19th and was submittable until 8:00 AM Monday the 22nd of June. The results were on par with the first two tests, with the average down an insignificant amount: Test one Test two Test three midterm 0.81 0.80 0.79 Of concern remains the nonsubmission rate on tests. I have students who simply cannot seem to get work turned in unless they have seven days to get the work done, and even then some work is unsubmitted. I remain concerned, however, that extending the time frame to take a test could compromise the test. Three and half days including a weekday evening (Thursday evening), a schedule that has been true for all three tests, feels like that should be sufficient time. Yet each Monday morning I have notes from students, often the same students, who want additional time. These students, ho...

MS 150 Statistics online week two update

Image
A visual look at the end of week two in online MS 150 statistics Submission rates for week one improved as students submitted work due week one during week two. Assignments are due on the next weekday with a seven day late turn-in grace period. This is absolutely necessary due to the many issues our students face in terms of unreliable power, limited access to Internet, the need to travel to access Internet, and equipment issues that the students have with their own technology. Week two submission rates are likely to improve during week three. Historically there is some fall off in the submission rates during the course of a term. Hints of that fall off can be seen in assignment 2.3 which lock for submission in 48 hours and may not achieve a 100% submission rate. Test one is also closed for submissions and saw a submission rate of 88%. Updated results for the student technology poll indicates that while the majority of students are accessing the course with a laptop or desktop,...

End of week one in online MS 150 Statistics: Submission rates and test one performance

Image
Submission rates were strong given that both students and faculty are new to online education. Test one saw strong performance against historic norms for the course, although two students are clearly struggling with the material if not also the new environment.

Stats video series engagement as measured by views

Image
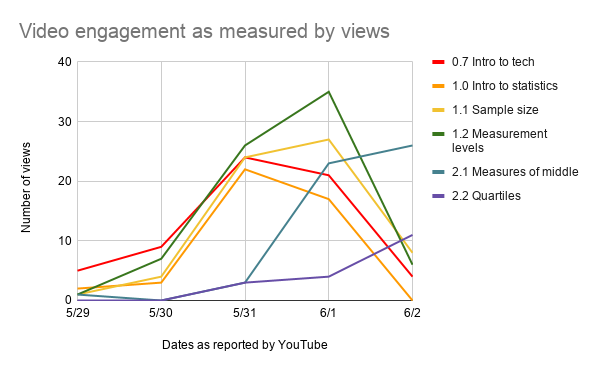
On day four of MS 150 Statistics, homework is coming in from 33 of my 34 students. All 34 are logging into the Schoology LMS and 33 are able to access Google Sheets through the Google Drive Assignments LTI. The following chart depicts engagement with the stats learning support videos as measured by views. Views is a potentially problematic metric, but serves as best available proxy for engagement. The dates appear to be off by a day, probably due to the dates being those recorded in California where YouTube is located. That said, there is a distinct rise in viewership as students reach a given section (the prefix numbers) and a fall off as they move on. These are raw views and do not tell one the number of unique viewers. These numbers do, however, suggest that the videos are being accessed by the students as they work on their homework each day.

Day one in MS 150 Statistics online

Image
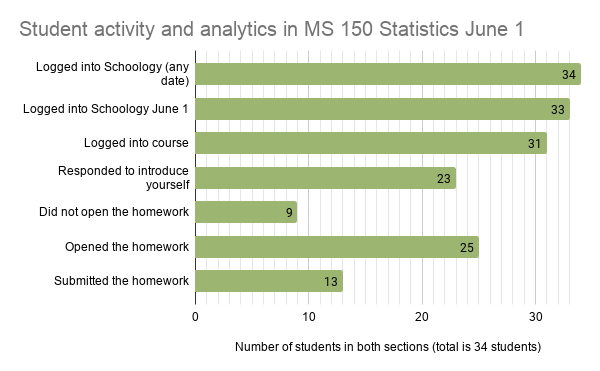
Having some insight into day one on a residential campus requires only that one walk the campus, interact with students and faculty. Having insight into day one for a campus that has moved into cyberspace is more challenging. The faculty are dispersed to their homes, the students scattered across thousands of miles of ocean. From my kitchen table I work with students in four states on five islands in two time zones. There is an invisibility to a cyberspace campus. These two charts provide some visibility in terms of raw numbers for two sections of a single course with 34 students in the course. Log in data provided by Schoology Analytics.