Heat conduction, latitude and longitude

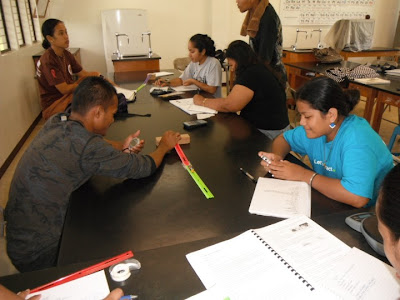
In spring 2011 I ran a one off experiment on heat capacity. The lab was complicated by a lack of different materials with the same mass. Thus materials that were tested varied in mass and composition. I returned to thermal conductivity in the fall of 2011 for laboratory 62 and stayed with thermal conductivity for spring 2012. The class had viewed a cartoon video on temperature and heat on Monday, followed by coverage of temperature scales on Wednesday. Joyceleen and Lotrynes track temperature changes Fall 2011 I opted to run a demonstration using the rebar and I tracked the temperature every two minutes. This modeling, not entirely intentional, led to the class generating two column time and temperature charts. This in turn led to xy scattergraph approaches and less diversity in chart choices during the group presentations. Emerson and Roxanne watch for the peak temperature In retrospect I did not like what had happened, the modeling had overly cha...


