Posts

Showing posts from August, 2011

RipStik acceleration

Image
In a previous article I shared the use of a RipStik in SC 130 Physical Science to demonstrate linear constant velocity motion. The ability to generate a relatively constant velocity by swizzling at a constant rate on level ground was useful to that demonstration. This term, as in the past two terms, the non-linea r motion of the rolling ball in laboratory two had already set up the concept of curved lines as changing speeds on a time versus distance xy scattergraph. This permitted me to move directly to data gathering for an accelerating RipStik. I did not achieve the top end that I typically attain, I am uncertain as to why. Prior to class I performed three practice runs with a goal of first pillar-to-pillar time of six to seven seconds. The hope was to hit an acceleration around 0.2 m/s². My actual run during class suggests an actual acceleration of 0.068 m/s². The chart belows compares the desired accelertion curve against my actual acceleration curve. The tim...

On the home front

Image
Wushu demonstration at the college gym. As can be seen on their faces, my son went on to enjoy the evening, my daughter was bored. A treasure box that was once in the basement of my paternal grandfather's house. My typical activity on a weekend. Marking papers. New JBI expansion store. Searching for mangoes Up in Dienm Kitti, Wearing 3D glasses improves one's ability to ride at night. Boy time. A badminton tournament started Sunday.

Rolling balls and linear relationships

Image
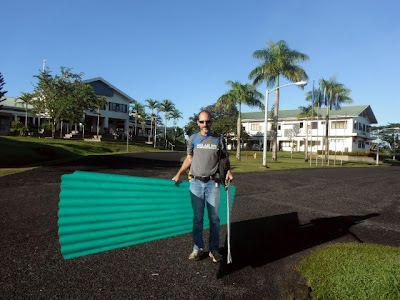
Fall 2011  laboratory 022 marked the third term of the even "no write up" laboratories. Assessment done spring 2011 indicated that the shift from writing up every laboratory to writing up only odd laboratories did not have a negative impact on the improvement in writing. This term I had the Nissan and thus could not transport the roofing sheet to the gym. So I walked it across campus on a very clear day with saturating humidity. The photo makes the morning look lovely but the humidity was so close to saturation that one was instantly lathered up in sweat. In laboratory 022 the location of the ball at each second is marked by a different student. Then the distance to the timing mark is determined. This makes the time the independent variable and the distance the dependent variable. As this laboratory is often done in physics, the distance is preset and becomes the independent variable, with a timing determining the time to that fixed distance - such as a photogat...

Ethnogardening

Image
Cleaning up the ethnogarden, the leading edge of fall term 2011.  Lisa works on the ilau, Clerodendrum inerme RinaRuth contemplates the lemon grass, Cymbopogon citratus  Neelma Pearl clears Merremia peltata off of Musa spp.  Maylanda examines uht, Musa spp.  Cleaning around the oahs, Metroxylon amicarum.  Barnson rakes.  Pauleen cleans an unknown plants as Trisha examines the same plant. Jeanette works around sawaen Hawaii, likely a variety of Colocasia esculenta.

RipStik in Physical Science: Linear Velocity

Image
To demonstrate linear motion while retaining some modicum of attention span from my social media saturated students, I again rode a RipStik along the sidewalk in front of the laboratory. The activity is built around the linear relationship between time and distance for an object moving at a constant velocity. Thus my goal was to retain a constant velocity over the 36.8 meter distance. In class I only wrote the time and distance data on the board, the following table was constructed later as part of my analysis of whether my speed was fairly constant.  Pillar Time (s) Dist (m) Vel (cm/s) Acc (cm/s²) one 0 0 two 3.86 4.6 1.19 three 6.89 9.2 1.52 0.11 four 9.64 13.8 1.67 0.06 five 12.45 18.4 1.64 -0.01 six 15.09 23 1.74 0.04 seven 17.84 27.6 ...

Assessment of graphing, plotting, calculating slopes

In order to generate and comprehend the mathematical models that live at the core of physical science systems, students have to be familiar with the xy coordinate system, plotting points, graphing lines, calculating and understanding slopes of lines. Eight questions that focused on graphing skills and which were tested on the first test summer 2011 were presented to the SC 130 Physical Science students fall 2011 on the first quiz of the term . The skills tested focus on student learning outcome 1.2 on the outline . Twenty-nine of thirty-two students sat quiz one fall 2011. Data from the first test summer 2011 and the first quiz fall 2011 is presented in the table. Percentages are the percent of students answering the item correctly. Summer 2011 the sample size was fifteen students. Question topic Su 11 Fall 11 Δ% calculate slope from line on graph 0.67 0.52 -0.15 density as equal to slope 0.47 0.38 -0.0...

Lycophytes and Monilophytes hike

Image
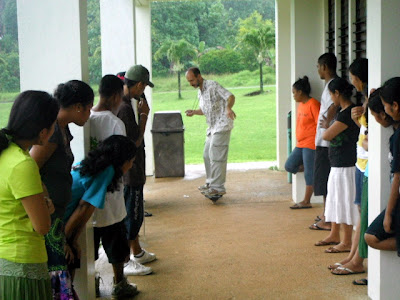
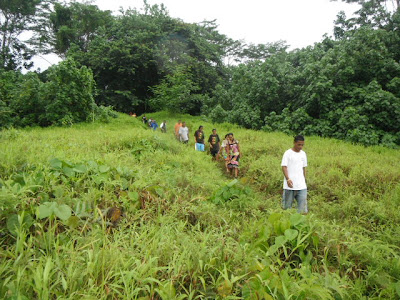
For the past five or more years the term has started on a Thursday, which meant that the first ethnobotany class was also on the first day of class at the end of the week. Attendance had suffered as a result. This term started on a Monday, which put the first ethnobotany class on the second day of classes on a full week of class. Attendance was strong with all but one student attending. The first day I brought in five plants as a pretest, the results of which were depressing . That introduction plus coverage of the syllabus left time only to cover cyanobacteria. The first day of class was wet and rainy, and the students were not yet prepped with the knowledge that ethnobotany walks under the rain. In view of this, I had brought in a specimen of cyanobacteria ( Nostoc ). Thus moss was not covered on the first day of class. On the second day of class, the class headed out on the hike into the valley of the monilophytes. I did not open the class, opting to leave from in front of the ...