Posts

Showing posts from February, 2024

8.2 Standard error of the mean

Image
This term I returned to the samples of five marbles to illustrate the spread of the data versus the spread of sample means. I used the above rig to mass the marbles and do the data entry. No preloading of names this term. Leniva weighing a marble. Although the number of samples was small at just six, the result illustrated the concepts underneath the standard error of the mean.

Rocks and minerals

Image
Unakite This term is decided to remove the text entry submission option as that led to some rather disorganized text only reports being submitted, laundry list types of reports. The rock kits have not yet been refreshed and could use a refresher. I did not formally introduce the use of Google Lens, but I did work with some students using Google Lens. The complication with Google Lens is that a macro lens is useful for getting a diagnostic image of the small rocks in these rock sets.  1500 wet or dry sandpaper was found to make an excellent black streak plate substitute. Blue calcite Leemay and Brenda select rocks Jasen and Kaylem at work identifying their rocks Jazzlyn and Darx Margarette looks for more ricks Daniel looks on as Hedweag and Margarette sort through the rocks Ciro looking at identifications  Hedweag and Lomalinda study an online rock identificat...

Botany lab eight: Leaf shapes, Snapseed, and Google Forms

Image
In preparation for laboratory eight I sent out a leaf shape reference sheet on Sunday evening. Subsequent to the laboratory session I produced a leaf shapes presentation for use in ethnobotany that could be used here as well. In class a presentation was used to cover the laboratory procedure. With everyone working on the same form there is a level chaos as students add questions nearly simultaneously and then wind up editing on top of each other. The presentation has been modified to have each student make their own individual quiz from a new form.  Student view of Google Forms on their cell phone. Forms does not have a dedicated app and has to be worked on in the browser. Some of my students did not know the word browser.  Google Snapseed is available for iOS, the screens differ on iOS from Android.  On an Apple iPhone the Export option is the bottom option, on Android Export is the middle option.  Students working ...

Dropout Detective

Image
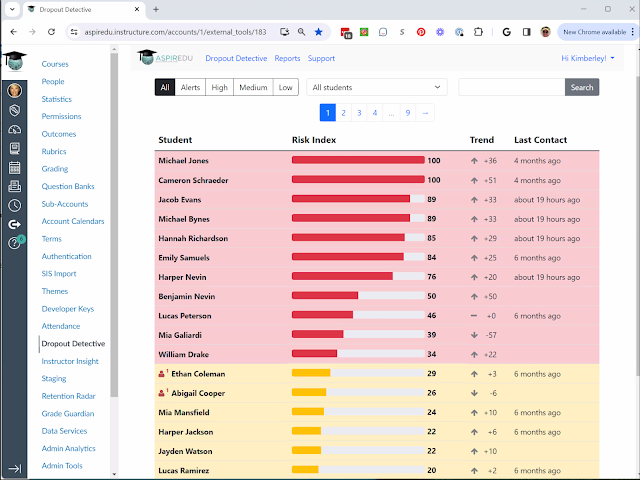
Dropout Detective pulls data every night after midnight from Canvas. Dropout Detective does not interact with the SIS, only with Canvas as an LTI.  LTI integration means that you find Dropout Detective within Canvas. Dropout Detective is not a separate login. Current view: account level. At the account level data is pulled from across all courses. Second view, later in the presentation, is through your courses. That is the level faculty will see in their courses. The following screenshots are at the systemwide administrative level, the level a systemwide counselor would see.  Personalized dashboards with groups of students. Cohorts can be tracked. You as a school build these. You build these yourself, you maintain them. Really powerful. And allows you to follow specific students. These dashboards also can be assigned to/restricted  We integrate to Canvas, not to the SIS. We look at data across all course. Log ins, grades, missing assignments, last assignment, where are we...

iPad survey

Image
An anonymous voluntary convenience sample of faculty were surveyed on their use of college supplied iPad tablets. The link to the survey was sent to faculty on the CTEC, Chuuk, Kosrae, National, and Yap campuses. Systemwide there are on the order of one hundred faculty members including part-time instructors. Part-time instructors would not have received an iPad but might have received the link to the survey.  Just over 80% of the respondents are making use of their iPad tablets. Note that respondents who said "No" to this question were branched to a "Why not?" section.  Of those who are using their iPad, almost two-thirds are making daily use of their iPad. On a scale from very useless to very useful with a three being a neutral midpoint, three-quarters of those who are using an iPad responded above a three.  Respondents who are using an iPad were asked open questions to get a more detailed view of iPad usage. To avoid interpretation, the raw answers for these sect...

7.1 7.3 Random distribution of beads

Image
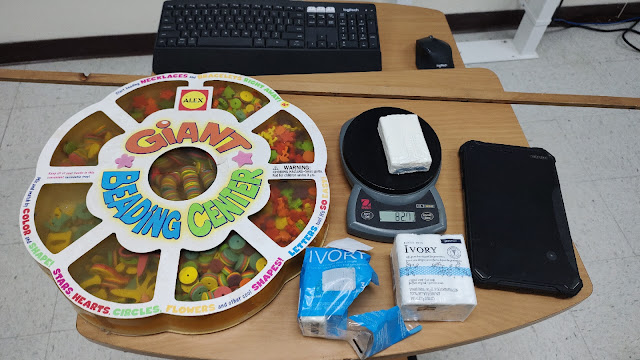
I modified the 7.1 introduction to the normal curve by beginning with five bars of 90g Ivory soap. The intent was to show that any measurement varies randomly.  The complication was that two bars were significantly older than the other three bars. And as I discovered  years ago, soap does slowly sublimate. Soap loses mass over a period of years. Despite the low mass, the two older bars were marked as being 90 gram bars of Ivory soap. This led to a strongly bimodal distribution. Soap of the same age and more bars of soap might have better illustrated a normal distribution.  The above photo was after counting the beads. This term I did not stand on anything. I just stood and tossed the beads.  Spreadsheet This term I again only looked at the distribution horizontally. The mean and standard deviation were generated by the spreadsheet. The distribution was nicely normal with 215 beads thrown. Smoothed out (the blue line) the distribution is only v...