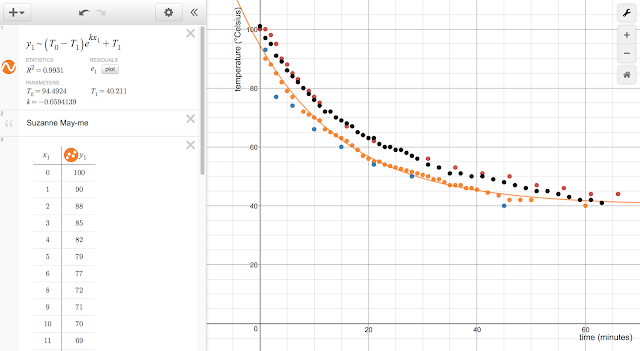
Cooling curves
A week of temperature and heat began with video on temperature, heat, and the difference between the two. Wednesday temperatures from melting ice to boiling water were mapped out.
Friday was spent getting to know the Celsius temperature system better. I first asked students to guess their own surface temperature. Then I had them guess temperatures followed by using a surface temperature reading device to determine the actual temperature in Celsius.
Suzanne takes a measurement. We learned that black cars are twenty degrees Celsius hotter than white cars, black shirts are ten degrees hotter than white shirt. In Celsius - these are big differences.
Data from cooling curves on Thursday
Temperatures measured on Wednesday
Temperature recorded from actual observations. Thursday an open investigation of cooling rate was launched. After data was gathered and non-linearity was seen, Newton's proposed law of cooling was introduced.
Selihter takes a temperature reading
Tulpe Nena graphs in Desmos
Hot water on the boil, Benter with Suzanne
Friday was spent getting to know the Celsius temperature system better. I first asked students to guess their own surface temperature. Then I had them guess temperatures followed by using a surface temperature reading device to determine the actual temperature in Celsius.
Suzanne takes a measurement. We learned that black cars are twenty degrees Celsius hotter than white cars, black shirts are ten degrees hotter than white shirt. In Celsius - these are big differences.
Taking note prior to measure refrigerator temperatures.
Claire measures temperatures
Justin measures a black car in the shade


Comments
Post a Comment