Posts

How many course level outcomes should a course have?

Image
As a division chair I was asked by faculty how many course level outcomes was the right number of course level student learning outcomes for a course outline. As a member of curriculum committee twenty years ago the question sometimes arose of whether an outline had too few or too many outcomes. If there is wisdom in collective decisions made over the years, then the outlines should now be able to help inform answers to these questions.  Based on student learning outcomes listed on the college web site, the college has 319 courses with 1648 course level student learning outcomes. The average number of outcomes per course is 5.2 with a most frequently occurring value of four outcomes per course. Four courses have only a single course level learning outcome, one course has 15. The chart suggests recommending three to no more than seven course learning outcomes. A course with four course learning outcomes mapping to four general education program learning outcomes. Diagram shows how a...

Grey goo

Image
Grey goo came up in a discussion at a college summit as part of a discussion on the implications of the current course outline structure on the aggregation of student learning outcome performance data. In light  of that discussion I wanted to use an actual course and outcome performance averages to explain what I mean by grey goo. At issue is a set of implied many-to-many relationships in the outlines. The result is higher level outcomes wind up averaging out to an overall population mean value. EN 120a is an expository writing course in the general education program. The course serves three program learning outcomes, has three course level student outcomes, and seven specific learning outcomes.  Program learning outcomes served GenEd 1.1 Write a clear, well organized paper using documentation and quantitative tools when appropriate. GenEd 2.1 Demonstrate the ability for independent thought and expression. GenEd 2.2 Demonstrate understanding of the modes of inquiry by identify...

Do Know Value: Learning terrain at the college

Image
Students will be able to...  Student learning outcomes all begin with a verb describing what a student will be able to do, to know, or to value. The college has 1648 course level student learning outcomes. The lead verb choice provides some meta-insight into the nature of the course learning outcomes. A tag cloud of first words in the 1648 course learning outcomes produces the following chart. The number of times a word appears as the first word in an outcome is given in the following chart. The top ten first words account for 64% of the course level student learning outcomes.  The most common lead words are describe and demonstrate, accounting for 36% of the first words for all course learning outcomes. Describe is often a lead in to having the student describe some system - show what they know. Demonstrate is often a lead in to the students doing something that evidences the learning outcome. Identify is a lead verb that often deals with knowledge. For each lead word in the ...

From Canvas outcome results to R to flexdashboard

Image
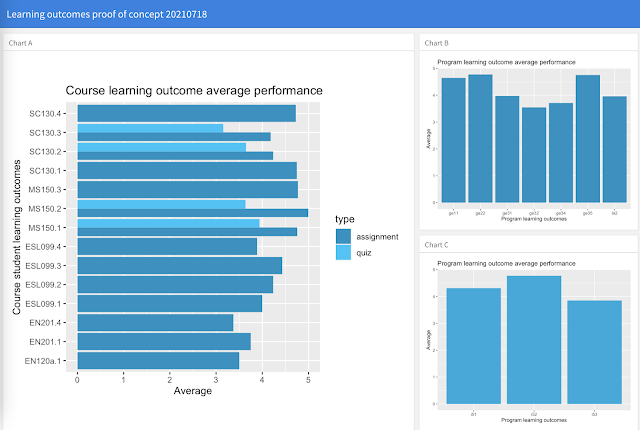
A week ago I began a journey to explore the admin outcomes report from Instructure Canvas. I began by struggling my way through to a chart , learned to select, mutate, and join with dplyr, and then connected two dimension tables separated by a main data table where each dimension table had a different primary key. This last step took me beyond where Google Data Studio can go at present - Data Studio must have a common key across all joined tables.  Today I took the results from the week and built a static dashboard of some of the results using flexdashboard. The code driving the dashboard was cleaned up including dropping comments and simplifying by some up front ETL work on the underlying tables, including the removal of a number of variables. The only error today was forgetting that to build the web page one has to issue an rmarkdown render command, rmarkdown::render("outcomes_20210718.Rmd") This week also included my own first foray into watching videos to learn a new s...

Canvas and R outcome results join to SIS and aggregating outcome dimensions

Image
One of the reasons for working in Google Data Studio is that Data Studio is free. The most crippling limitation is that all tables must share a common key. This is a problem for the Canvas outcome results analysis. The learning outcome names (clso in my R code below) are aggregated by a dimension table with program and institutional learning outcome mappings. The only connection back to a student information system dimension table, however, is via IDNumber. Data Studio dashboards can display either performances aggregated by course, program, and institutional learning outcomes, or performances aggregated by course learning outcomes and SIS variables. Data Studio cannot report SIS variables against program or institutional learning outcomes. Such as gender versus program learning outcomes (pslos). One could pre-process to build a single massive union table and dump that into Data Studio, but if one has software that does that already, what would be the point of using Data Studio? Obviou...

Summer session 2021 week seven analytics

Image
Systemwide metrics Week seven brought closure to the regular summer term. A few courses for new freshman which started a couple weeks behind the regular summer term remain in session. Of note this week was the appearance for the first time of course learning outcomes from the institutional bank of course learning outcomes in Canvas from courses other than my own MS 150 Statistics and SC 130 Physical Science courses. The above dashboard was explored in a video . Another  video  explains how to add these institutionally stored course learning outcomes to any college course in Canvas. This dashboard, along with others that have been produced, remain proof of concept explorations. The design and the metrics reported can be specified by the college. The data powering the dashboard is actual data from those courses. Trends by category in Canvas remained consistent with the trends seen over the past four weeks.  The surprise this week was a spike in page views on Monday. Monday...

Instructure Canvas outcome results R dplyr select mutate left_join

Image
This is a second day of looking at using R to explore the Instructure Canvas admin outcome results file. In my earlier exploration I tackled using group_by and ggplot to display student learning outcome averages by course level learning outcomes. My intent in a second day of work was to perform some extract, transform, and load (ETL) operations up front on the actual CSV export file from Canvas, rename their space punctuated variables, rescale the outcome scores to all be on a five point scale, join the table to a dimension table on a left outer join, and then generate essentially the same graph as I had generated earlier.  Canvas exports tidy data in the outcome results file which makes possible the use of readr and dplyr from the tidyverse package. That the data is tidy apparently saves weeks of potential cleaning work . Beyond basic file loading and ggplot work, the following code uses dplyr select to both select and rename eight of the thirty variables in the original CS...