Arcminutes of longitude
With rain bands rolling over the ridge during the morning session, the class was instructed to meet at the dining hall. At 11:30 the sky was fairly clear. Satellite photos suggested further rain bands were headed towards Pohnpei.
A northward shift cleared the Terminalia catappa.


 Mary-ellen and Emars

 Selfie time


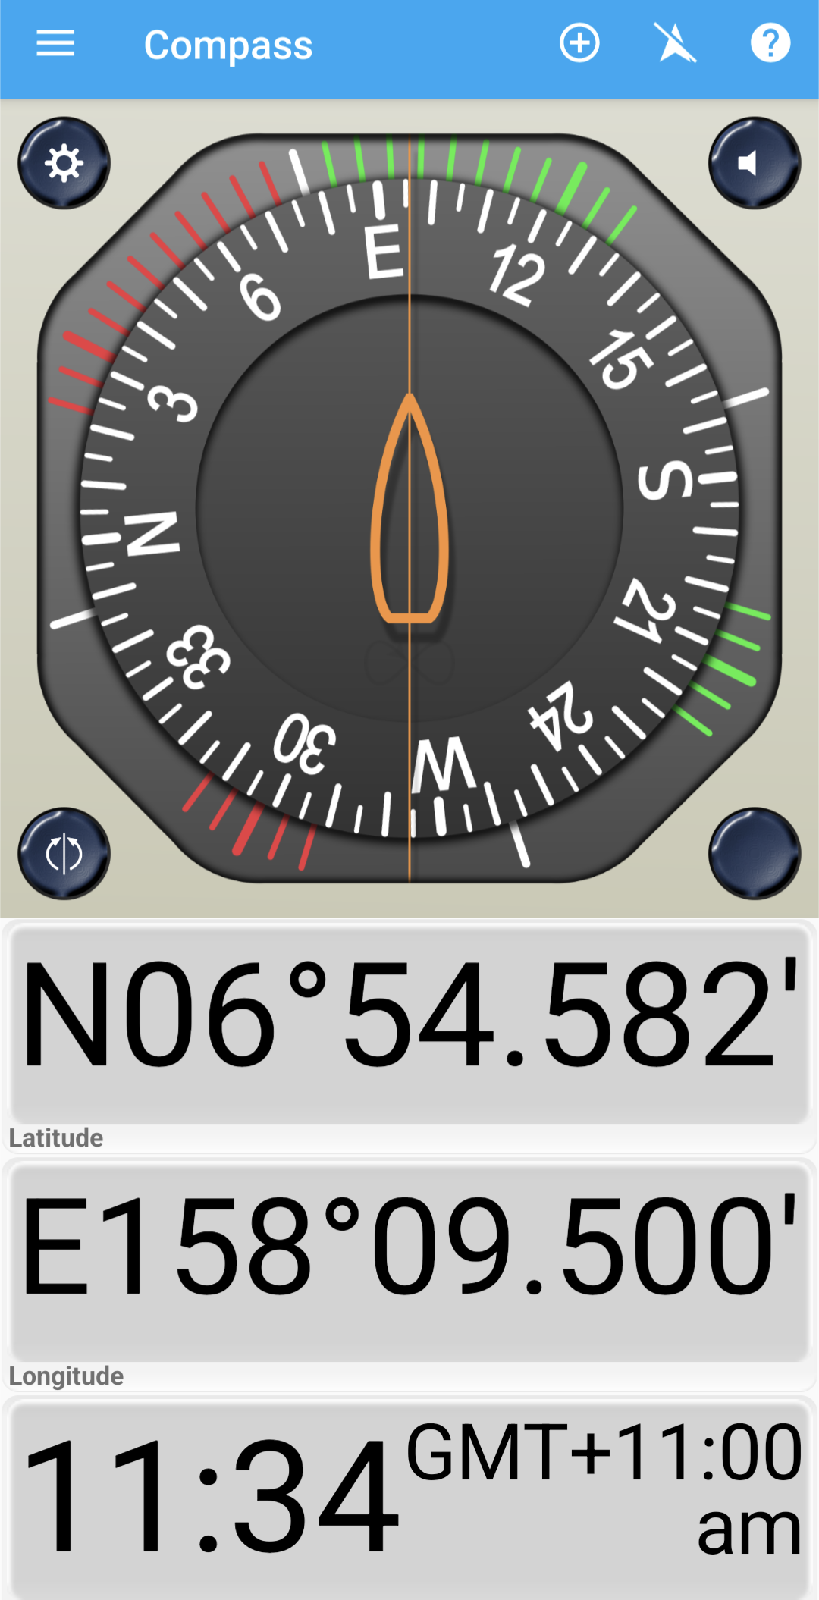
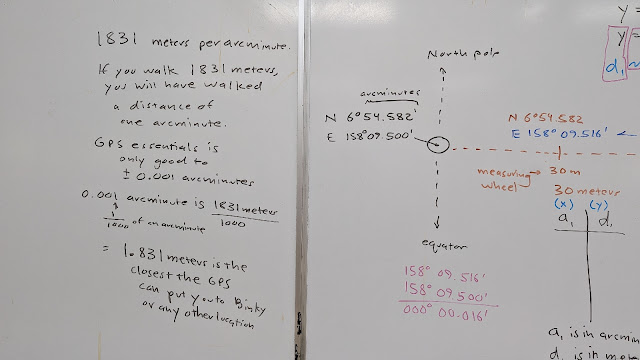
 1.831 meters

The explanation was post hoc. The class had blank looks. Now an hour after lunch, early afternoon grogginess had set in. One could sense that the explanation was bouncing off of brain cases.
 Clayton gave Binky to Emars


Given that the five data points from 0 to 120 meters at 30 Meyer intervals would be sufficient, start was shifted to near the bookstore. An early morning sortie had determined that the health clinic fence was on the ground at North 06° 54.578', East 158° 09.637'. This provided a way to extend alongside and beyond the health clinic off of a bookstore start.

At the bookstore a North 06° 54.578' line of latitude was obstructed out around 60 meters by a Terminalia catappa.
A northward shift cleared the Terminalia catappa.
The rough starting point.
Looking east, wide angle
Looking east, 1.0x
At 2.0x from the shifted location, the Terminalia catappa can be seen to the right.
5.0x suggests the latitude line might pass between the huts downrange.
The gap in the distant orange fence can be made out at 30x.
The class was slow to reassemble. The launch was around 11:36 with only three students, but the rest who were in attendance arrived by the 30 meter mark.
The possibility of rain pushed for a launch as early in the rain gap as possible. That drove a zero explanation launch. Bear in mind only three students had Android phones, one more than the morning session. Mary-ellen had gone home during the break and swapped her iPhone for an Android.
The gap in the fence. Beyond is a zone used by local canines as a toilet area. Oops
Under the fence to get 360 meters. Should have pushed a little further as 0.200 arcminutes was only six meters ahead, just 19 feet to the east.
A larger gap under the fence.
The explanation was post hoc. The class had blank looks. Now an hour after lunch, early afternoon grogginess had set in. One could sense that the explanation was bouncing off of brain cases.
At the top of the board was an attempt to map from Desmos' linear regression to the physical science equation.
The left hand panel was the final panel.
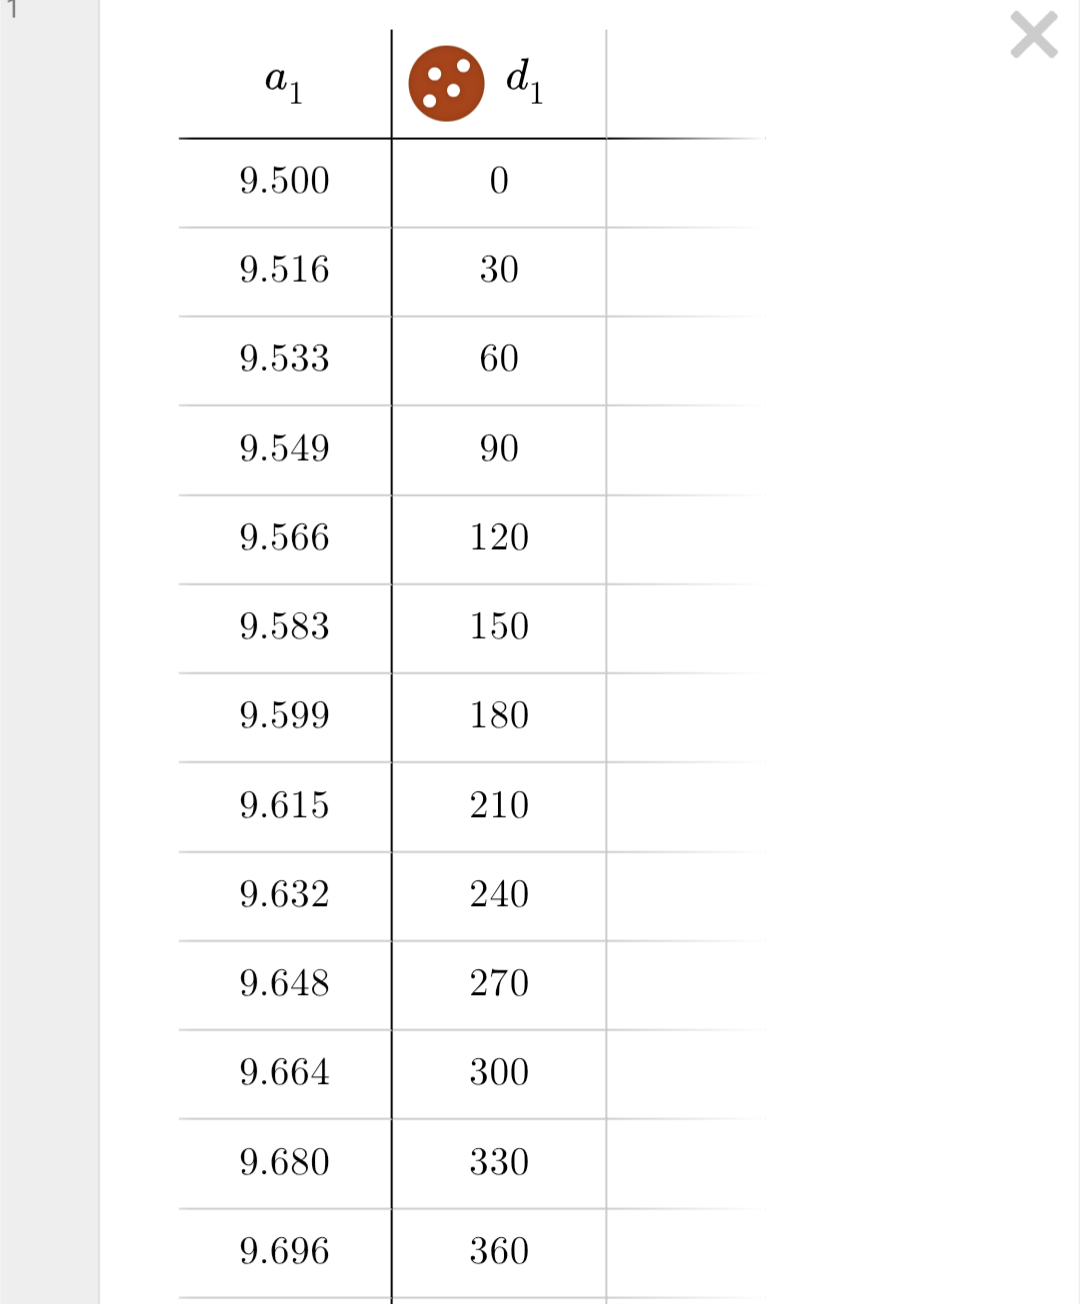
This term a choice was made to not try to force a zero start in arcminutes. The arcminutes were included in full, including the digit in the ones position. This generated a non-zero y-intercept, which would lead to the Linear Regression facility producing a valid equation. This approach worked, yet there is a lot to unpack pedagogically. Does this approach obscure the nature of the conversion function? Would the students be any more confused by the 9.500 start than they were with the subtraction process used in the field in every prior term? Net is that this approach appears to be simpler to use in the field, but at the same time the approach obscures the distance in arcminutes walked for the students. The zero arcminutes start makes more clear the distance that is measured in arcminutes. Yet that is only theoretically more clear, not underpinned by any evaluation. Post hoc on the board the diagram can be used to make more clear that there are two measurment systems tracking the distance walked. This approach is worth another try. A pre-walk talk would undoubtedly help, which is possible in the regular term.
Desmos table
Data graph
The students have been discouraged from using the Linear Regression facility in Desmos as the tool doesn't use the variables in the data table. That effort has not yielded fruit. Students return time and again to the automatic Linear Regression facility. Hence the earlier note on top of the right board. A shift to joining what cannot be beat. To show the students how to use the Linear Regression facility to aid in the construction of the regression function using the correct variables. Use all of the tools at one's disposal.
The intent was to teach the students to map from the provided Linear Regression to the physical science equation. The complication is that this approach works best when the system has a non-zero y-intercept. There are many systems in which the y-intercept is known to be zero and must be zero, where a y-intercept is known to be in error. The Linear Regression facility will report a y-intercept where one should not be included.
There is value in keeping the 9.500' start and the y-intercept in order to tackle mapping the Linear Regression facility to the variables in use.
Comments
Post a Comment