Acceleration of a RipStik and gravity
On Wednesday the velocity of the RipStik was a constant. Starting from velocity = distance ÷ time yields the rearranged formula distance = velocity × time. One might note that, technically speaking, velocity = Δdistance ÷ Δtime. If distance and time are not taken to be changing, velocity is not happening.
Time versus distance produces a straight line the slope of which is just the constant velocity, 0.2 m/s in the above example.
Consider what the graph looks like for time versus velocity. The velocity remains a constant 0.2 m/s. The formula distance = velocity × time is, graphically speaking, a rectangle with one side equal to the velocity and the other equal to the time. The distance is the area "under" the velocity line. That is a core idea.
Consider a RipStik accelerating at 0.2 m/s each and every second.
Every second the RipStik is moving faster by 0.2 meters per second. Recalling that velocity = distance ÷ time, then distance = velocity × time. So how far has the RipStik gone after one second? One might at first think that the distance must be 0.2 m/s × 1 second, but that would work only if the RipStik were traveling at 0.2 m/s for the whole second. But the RipStik started from a speed of 0 m/s, not 0.2 m/s. So how far did the RipStik actually go?
There are a couple ways to think about this. The first is that the RipStik started at 0 m/s and ended at 0.2 m/s. Over this one second the average speed was halfway between those values: 0.1 m/s. Thus thus distance, which is velocity × time, is 0.1 m/s × 1 second or 0.1 meters
A second way is to realize that the formula distance = velocity × time for a constant velocity forms a rectangle. The formula velocity × time is just the formula for the area of a rectangle when the speed is a constant. In the above diagram we can see a triangle. That area is ½ base × height, which is ½ time × velocity at the end of the time. This is ½ (1 second) × (0.2 m/s) which is, again, 0.1 m/s.
The result time versus distance table can be seen above. A parabola is generated, a direct consequence of the distance growing with the area.
Following on the discovery of the benefit of a launch from the LRC, chalk marks were laid down ahead of class.
Thursday opened with a review of Wednesday.
Then I asked students were asked to sketch the the time versus distance for a RipStik that began at speed zero and then began going faster and faster.
There were some surprisingly accurate predictions, but they were few in number.
I had prepped for a 21 meter run off of the LRC, but ended up running out to 27 meters. The LRC take off is subtle. The slope provides the initial acceleration, but then there is a transition to flat sidewalk at nine meters. I was self-timing on the newer three decimal place timer.
The data was roughly parabolic. But the rate of velocity increase was more chaotic than it might appear from the above.
The acceleration was lower than the morning trial run which had come in around 0.18 m/s². The velocity table is automatically populated using the reference notation in Desmos.
Rescaling reveals the non-linear acceleration.
Thst yields an estimated acceleration of 0.12 m/s².
After the run the class returned to A101. I tried to show that ½ base × height explains the ½ in the upcoming formula, but I blanked on explaining the square. I forgot that the quadratic behavior only emerges when one considers the distance traveled after one second two seconds, three seconds. My decision to use a realistic acceleration of 0.2 m/s² did not help. I got bogged down trying to get to the quadratic relationship from a single triangle and hit a dead end. Returning to 2 m/s² would yield distances of 1 meter, 4 meters, and 9 meters for the first three seconds and would make more apparent the quadratic nature of the distance.
I abandoned the approach and moved to the general equation.
An explanation of the linkage back to algebra wrapped the morning session.
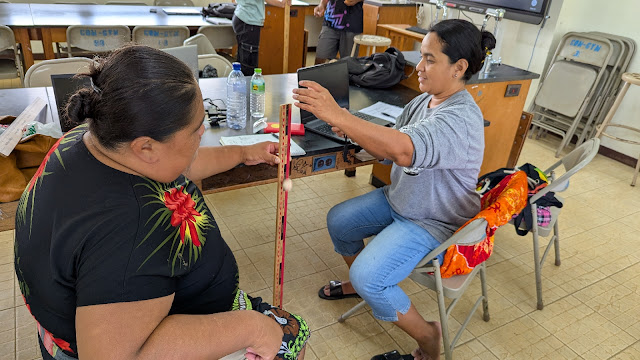
Ruthy "Shannon" and Mary-ellen timing ball drops from one meter. Five drops from each height only the median is recorded.Nicole and Rusty
Board notes
Wrap up on Thursday covered the report structure.
Gear for Friday demonstrations of acceleration and velocity effects
I then showed a variation on the Bernoulli effect that is more often referred to as the Venturi effect using a ping pong ball in a funnel.
Finally I demonstrated the Magnus effect.


Comments
Post a Comment