Canvas analytics week three spring 2023
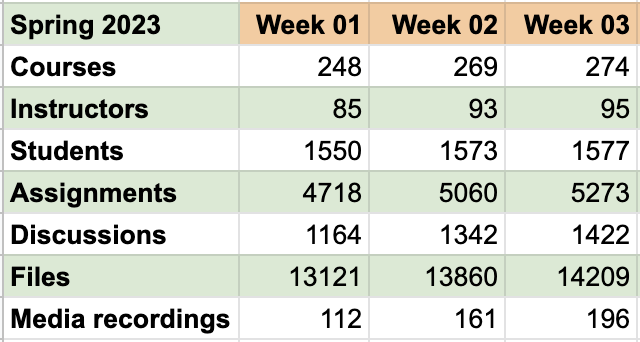
Week three saw an uptick in the number of courses and instructors on the platform as efforts to ensure all courses have a presence on Instructure Canvas at the college bore fruit.
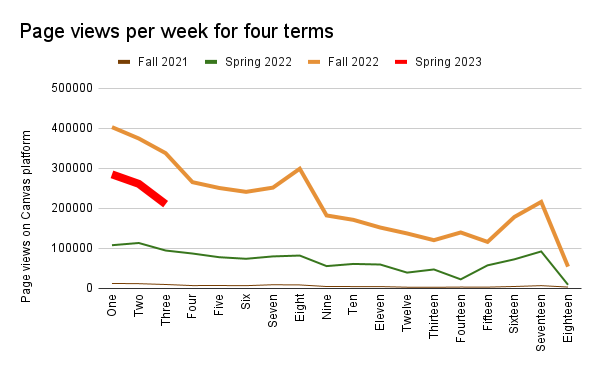
Standardizing the page views against the maximum number of page views per week for a term provides a better comparison between terms. Thus far, although spring 2023 started off with fewer page views than fall 2022, the drop from week one to week three has not been significantly different than that seen in prior terms.
Week three has shown some weakness coming into the end of the week. Whether this reflects disengagement or simply fewer assignments being due in is unknown.
Page views by activity has not been previously tracked. Note that for prior terms the values are those at term end, for spring 2023 the values are as of week three. An admin guide does not indicate that general and other are generated by user participation. The exclusive sum does not include these two unexplained categories.
Using the exclusive sum, a relative share of page views can be calculated.
A chart of the categories with leading shares of participatory page views suggests that spring 2023 is not different in overall distribution from prior terms. With spring 2023 having only just begun, the quizzes (tests) share would be expected to be low, and that in turn lifts the relative share of files and discussions. Page views of Grades are also down slightly, another effect of this data being early in the term. If there is disengagement occurring, then that disengagement is spread across the categories.
The statistics page shows a snapshot view of activity in the current account. Statistics provide current information about your account but you can also view information over time. Statistics work in conjunction with Account Analytics, which can also be viewed from the Statistics page.
You can view account analytics from your account's Courses page. You can also view analytics as part of the account Statistics page. Account analytics show aggregate data for all course activity in your account, including an overview of the number of courses and users and the activity types with which users engage.
Although the differences are not described, some values on the Statistics page are multi-term statistics such as the number of courses and storage values. Other values, such as the number of students, do not appear to be the sum across multiple terms.
One of the questions that has arisen is the nature of storage quotas in courses as the storage quota for a course does not appear to include materials copied into a current course from a prior run of the course. Materials only appear to count against the 500 Mb course storage limit in the term in which the material was added. This would suggest that a course could add 500 Mb of materials each term indefinitely. This cannot be the case because cloud storage is costly. A secondary question was whether an admin can raise the storage quota for a specific course and what would the impact of that be.
The answer is in the following paragraph:
Uploaded File Storage indicates the amount of files stored and the number of files in all courses for the entire account. Deleted files are not included. To learn about specific file quota details, view the Course Files Quota resource document. The file storage limit is calculated with the number of full-time enrollments (FTE) in your institution (default is 500 MB/FTE). To calculate the amount of file storage used in your account, convert the Uploaded file storage number shown to MB (e.g. 1.88 GB is 1880 MB). Then take the number of full-time enrollments and multiply the MB per enrollment (e.g. 3,000 FTE x 500 MB). If the converted number is lower than the multiplied number, your institution is within your file storage limit. If the number is higher, contact your Customer Success Manager for additional storage options. You can also change the quota for all course or specific courses.
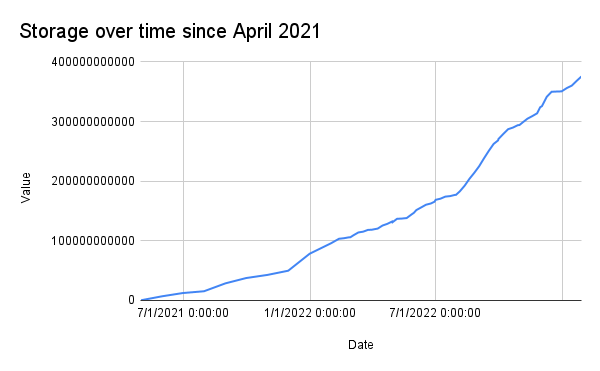
I gather that the institution was operating on a 1700 FTE per term contract. That would imply an 850 Gb upper limit, after which there will be storage fees incurred. The college is currently at 350 Gb of storage, or about 41% of the allotted storage under the contract.
Storage space growth over has not been linear as the growth of faculty and students on the platform has not been linear.
That said, this metric should be watched to, among other reasons, determine if the growth remains linear. This is the first full academic year of all faculty being on the platform, perhaps some of the growth is being driven by the first time addition of course materials. The linearity across fall 2022, however, suggests that growth is being driven not by episodic addition of materials but rather by ongoing activity on the platform: student submissions for example.
This also suggests that there is a longer term cost benefit to encouraging faculty to use storage space friendly options which are also often student friendly options. For example, where possible, using YouTube videos instead of storing videos on Canvas. Using Canvas Pages rather than uploading PDF files. Canvas Pages are HTML text files and are usually smaller than a PDF which is a container including contents, formatting, and fonts. Both YouTube and Canvas Pages tend to be more accessible for students on limited bandwidth than videos uploaded to Canvas or PDF files which are often display problematically on mobile devices.
Although faculty could theoretically be encouraged to delete old, no longer used materials, finding these materials and deleting them is not particularly easy and is labor intensive. Efforts to clean out old materials are unlikely to have a significant impact on storage. Too, if the storage growth is being driven by student submissions, those are retained and there appears to be no way to bulk delete submissions even if one wanted to do so.


Comments
Post a Comment