Friction
After what was a failure to demonstrate that force is equal to a change in momentum, Wednesday was devoted to coverage of Newton's laws of motion and force from a RipStik. This is a lecture-demonstration done while riding a RipStik and holding a ball as seen in images captured last fall.
Thursday's laboratory turned attention to the issue of friction and what has the largest impact on the force of friction.


The red line is the roughness data (using particle size in micrometers), the purple line is the weight data, and the blue line is the surface area data (in square centimeters) for three sets of data.

The set up on the board on Thursday.
On Friday each group presented their findings to the class.

The groups investigating weight generally found slopes between 0.23 and 0.26. These were dimensionless constants as the force of friction and the weights were both in gram-force.
The surface area data included data from only a single group. Their data suggested a moderate to weak negative correlation.

Roughness split at plus and minus 0.03 gram-force per micrometer of particle size. The correlation was not strong and the split suggested a slope of zero was a possibility. The concept that a slope of zero means that there is no relationship was covered at the end of the class.
Thursday's laboratory turned attention to the issue of friction and what has the largest impact on the force of friction.

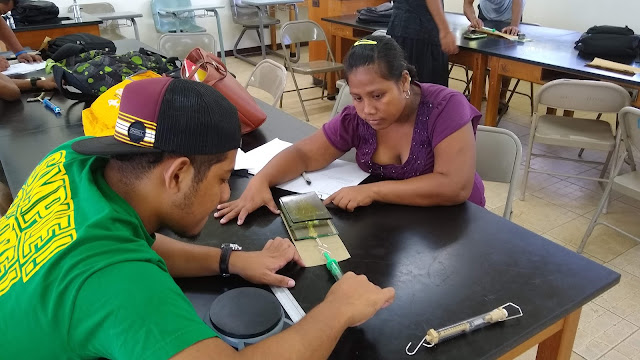
Rangpino and Dorothy working on whether surface area affects the force of friction

Stacey and Janice Stacia working on the effect of weight on the force of friction

Merenda and Maylina worked on how surface roughness affects the force of friction

The red line is the roughness data (using particle size in micrometers), the purple line is the weight data, and the blue line is the surface area data (in square centimeters) for three sets of data.

The set up on the board on Thursday.
On Friday each group presented their findings to the class.

The groups investigating weight generally found slopes between 0.23 and 0.26. These were dimensionless constants as the force of friction and the weights were both in gram-force.
The surface area data included data from only a single group. Their data suggested a moderate to weak negative correlation.

Roughness split at plus and minus 0.03 gram-force per micrometer of particle size. The correlation was not strong and the split suggested a slope of zero was a possibility. The concept that a slope of zero means that there is no relationship was covered at the end of the class.
Comments
Post a Comment