Botany lab seven: celery xylem conduction
The intent was to obtain data that could modeled as a linear regression using Desmos. This plan was rapidly abandoned when I realized I had one current and two former students in statistics in the class.


As it became clear that the data was not going to be a clean linear relationship, I gathered data on the SMARTboard.

%20vs.%20Time%20(min).png)

Two bags of celery provided four bundles. Each pair needed a bundle. Mistakes were of course made. I went for 150 ml of water in the beakers as seen above. This would prove too dilute of a mixture even with twenty drops of liquid red food color. A later test with pure dye would prove the most effective. Clearly the water should be a minimal bottom layer, including perhaps use of a smaller beaker. The 500 ml beakers meant that the shorter pieces tended to fall over. Packing the celery into 100 ml beakers might actually work better and would allow a much higher concentration of food color. I eventually went with 30 drops of food color and this was just barely visible at the celery tops.
Students were instructed to have 5 different lengths of celery. The celery would max out at 18.7 cm.
Lee Sandra measures a length of celery. All of their pieces were on the longer side. Having a few shorter pieces is probably beneficial to this lab.
Aleina cuts lengths of celery while Benselyn and Joana observe.
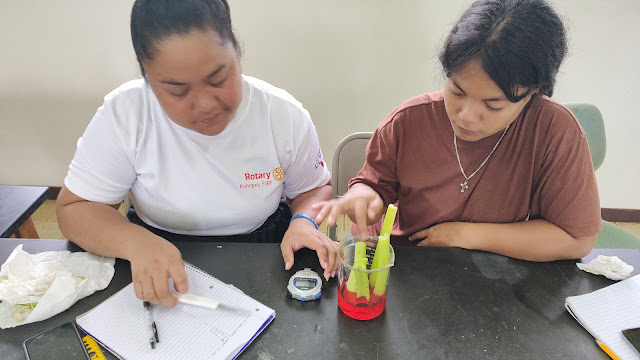
Kaetani and Devron. Timers allowed each group to start at their own time.

A good selection of celery, but I now know that the solution is too dilute.
Lee Sandra and Sonya demonstrate the set up concept.
Accidents happen. The dye on the short celery was a result of post hoc increasing the amount of food color in the water.
Success comes with extremely high concentrations of food color dye. This is a very short pice of celery in pure food color solution, no water.
Board notes before the lab.
The mean rate of conduction was 0.19 cm per minute. Extrapolated to a 77 foot tall celery stalk, one the height of the mango tree, and one gets 8.5 days for water to reach the top.


The rates of conduction varied widely and were not tightly correlated to celery length. The correlation was a low moderate of 0.38.
%20vs.%20Time%20(min).png)

A deeper dive reveals that the slope could be zero, p-value of 0.15 for a null hypothesis that the slope is zero. So there is the possibility of no statistical relationship in the data. Clearly there are other variables in play.


Comments
Post a Comment