Statistics chapter three: basic charts
There is a 3.1 circle and column chart data sets spreadsheet that frames the introduction to charts. This data is updated from an institutional dashboard.


 The sample size is 100 for the above, again, the bucket width has been adjusted to reflect the interval level of measurement. Then other shapes were shown to the students.
3.2 rolls with the favorite color spreadsheet. This spreadsheet remains in a pre-existing account and should be copied at some point. Moving is not an option. There is an associated form to query the online section.
I went with a blue shirt with black print, a black t-shirt with blue print, green pants, red underneath. This was a change from the past, but worked. A preset blue, black, green, red list on a post-it note, covered by a second post-it, was left with a student. Blue edged black by one with a tie below that led to the mode question. Then a black arrived tying the top. Then a blue arrived, pushing blue back to the top.
For 3.3, as in the past, I hand worked data from the 2.1 spreadsheet on the board to explain the concept of how a histogram is put together. I later circled back around to the frequency table.
For 3.4 I used a prior term's approach of giving every student seven marbles and a die. Students rolled the die and then passed that number of marbles to the right.

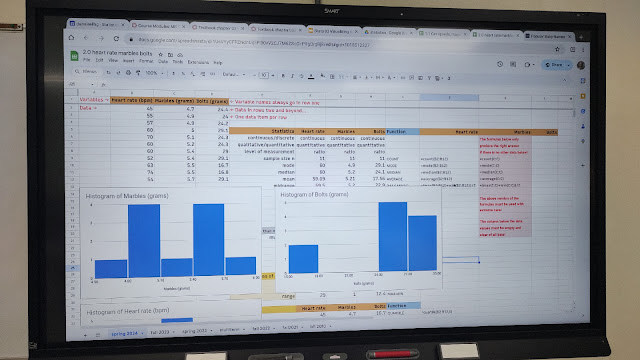
Note that to get the histogram to appear as above I adjusted the buckets. Google opted for a five class histogram and fractional class upper limits. The marbles, however, are interval level data - something which I asked the class about. With a sample size of eleven, guidance is that the number of classes should be the square root of eleven which is 3.3, or, in given the interval level of measurement, just 3. The result was a relatively symmetric distribution.
The spreadsheet also produces a theoretic distribution on another tab.


Comments
Post a Comment