Canvas has introduced a new analytics dashboard as an external tool. Where the earlier dashboard was termed Analytics, the new dashboard is referred to as Admin Analytics. For a while Admin Analytics was labeled New Analytics. The new Admin Analytics and the prior Analytics do not exactly match each other number for number. There are reasons for this. For example, Analytics appears to have counted every course in the course count. Admin Analytics counts courses that have an instructor, at least three students, are published, and have at least one page view. Analytics is not specific about the definition used, but could have included inactive courses without page views.
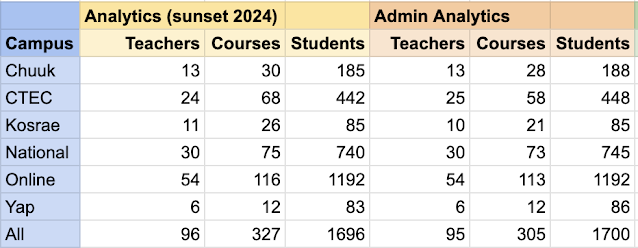
A comparison of the metrics reported by the two dashboard systems
The table above compares the metrics for the number of instructors, courses, and students reported by the pre-existing Analytics dashboard and the new Admin Analytics dashboard. The differences appear to relate primarily to differences in underlying definitions.
The pre-existing Analytics dashboard was a single dashboard with only very basic statistics cited.
The new Admin Analytics dashboard brings both interactive dashboard capabilities and more details than were available on the Analytics dashboard, especially in terms of course published status and activity along with student performance metrics.
The new Admin Analytics dashboard consists of three main dashboards - an Overview, Courses, and Students. The Overview dashboard provided the teacher counts. The numbers for the Admin Analytics dashboard appear to match best when the number of instructors is calculated from the upper right hand chart using the sum of the number of instructors with one or more active courses. The dashboard has drill down capabilities and the seven instructors listed without course activity appear to be a result of residential courses that are not using Canvas.

While the older Analytics dashboard counted 327 courses, the new dashboard reports 305 published courses that meet the above definition. There are another 61 inactive courses, some of which are the residential courses that are not using Canvas, but many of the 61 are courses that were cancelled for one reason or another. The older dashboard did not have drill down capabilities, thus sorting out why the older dashboard reported a number between 305 and 366 does not appear possible. The 305 number appears to represent a more realistic picture of active courses on Canvas than the 327 value or the 366 value.
The number of enrolled students can be obtained from the third Admin Analytics dashboard. The 722 number is the number of students with a score below 60% in any course. Again, the new dashboard provides more details and more information. Each chart is interactive and one can drill down into the underlying data.
The above chart is based on the Admin Analytics values for each campus - the Admin Analytics dashboard can report values by subaccount. In the above chart the number of students was divided by ten for vertical scale purposes. One can see that the online campus remains the largest campus in terms of instructors, courses, and students. The chart is the values seen in the three rightmost columns of the first table above.
The online campus has 43% of the students at the college as measured by the number of students active in the subaccount. Obviously the above chart is double counting students who have online and residential courses. The above chart suggests that there are around 500 students who are only taking residential courses and have no online courses.
The data permits a rough estimate of the student to teacher ratios for each campus. Some sources cite a United States national average of 18:1 and suggest that this is a reasonable target value. Overall, the college hits this mark exactly at 18:1 across all campuses. Note that FSM-FMI is not included in any of these calculations.
Currently 75 course learning outcomes are being reported using the institutional bank of course learning outcomes in Canvas. In the above dashboard the outcomes report against the program and institutional learning outcomes (both the eight existing outcomes and the five proposed aligned institutional learning outcomes based on the recommendations of Linda Suskie at the college assessment summit of 2017). Outcomes data in image current to 24 November 2023.
Pilot demonstration of disaggregation of the proposed five institutional learning outcomes against student information system variables including gender, state of origin, major, and age decade. Data in image current to 24 November 2023.


.png)


Comments
Post a Comment