Desmos: Referencing values in multiple tables from another table
In physical science each laboratory group is producing their own measurements of a phenomenon and using Desmos to graph their data and obtain a best fit mathematical model.
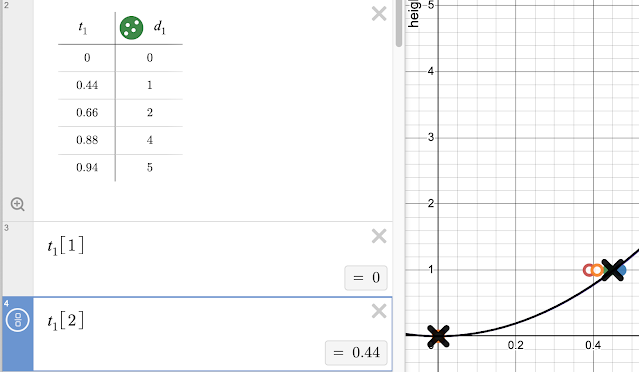
The above data are the times for a ball to fall from the heights in the right hand column. Five groups performed the experiment generating five data tables. I wanted to make a single table that used the mean or median values for each time at each height and I did not want to manually calculate those means or medians.
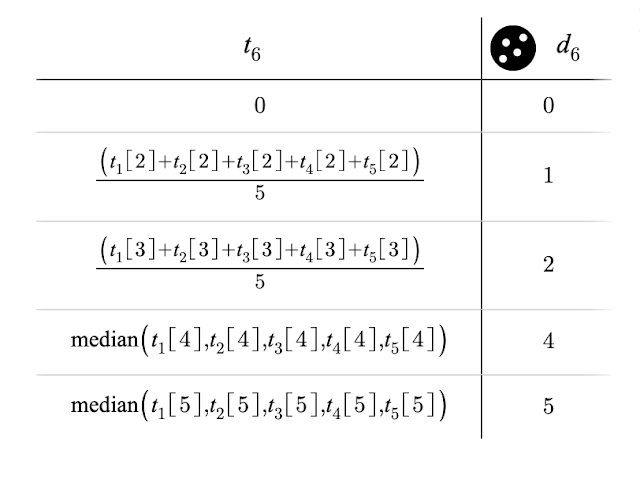
Cells in a table can handle mathematical operations and functions. Above two of the rows are calculating the mean time from all five tables using an arithmetic function, two of the rows are using the median function to obtain the median value for the list of five values pulled from the five tables above.
The result of this can be seen as the black × data points on the graph.
The resulting estimate for the acceleration of gravity g is remarkably close to that for Pohnpei. The actual acceleration of gravity at Pohnpei is 9.78995 meters per second squared. The above result of 9.76286 m/s² is within 0.02709 m/s² of the known value. For the purposes of illustrating the reference capabilities of Desmos two different functions were used, in practice the course usually uses only the median to exclude outliers. In physical science extreme outliers are usually errors in measurement.


Comments
Post a Comment