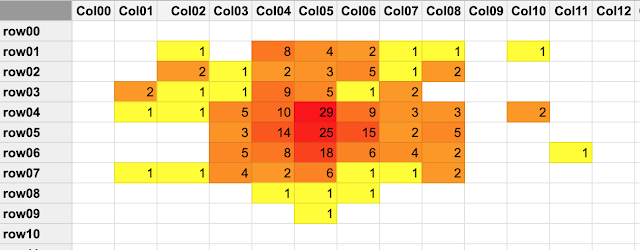
7.1 Random distribution of beads
I used the two-dimensional bead distribution spreadsheet developed fall 2022 to attempt to show that the beads land in a normally distributed manner. Again, the Tripltek tablet was crucial to gathering data, which was simultaneously appearing on the board.
And while this is slick and generates two normal distributions, the current process skips the step of moving from a discrete columnar histogram to a continuous line histogram. Based on questions at the end of class, this confused students because the 7.1 homework is a discrete columnar histogram. As was the case last fall, this particular path moved quickly to Desmos, but probably too quickly.
While I could use only the row totals as that would be easier to work with, row00 is affected by the east wall leading to a fat left tail. The columnar totals remain the more normally distributed and should be kept. Also, the leftmost column should be all zeros to bring the left tail to the x-axis.
The columnar totals rather well match the normal distribution except that the beads have a taller peak in terms of relative frequency. This should avoid the need to shift to Desmos, a shift that does appear to confuse the students.
Adding to the confusion was that the new smartboard has no markers. Those may be with an administrator at this point.


Comments
Post a Comment