Acceleration of gravity on day three
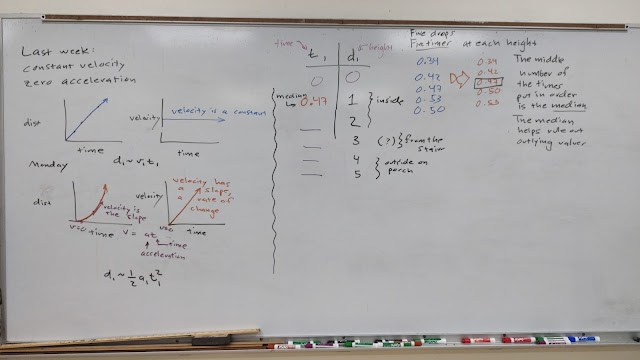
The board from Wednesday was intact, so I followed the path I took fall 2022 and used the start of the lab to pull together the last week and half. I included the velocity versus time graphs, although these graphs appear to remain confusing for the students to think about.
The above was still on the board from the day before. I would add a velocity line to this graph later.
Jonathan and Athina Viola working at one meter
Morales and Sharla also working at one meter
Mersayes and Ashlen performing drop times from one meter
Mersayes and Ashlen at two meters
Working at four and five meters
Conditions were wet in wind driven rain
Left board by 8:00 section end
Right board 8:00 section end
Acceleration of gravity results
Which value is correct? In some sense these are all correct: each represents the best measurement effort of a particular lab team. In another sense these are all incorrect because none are the known value of 9.78995 m/s² for our location. Yet the reduced acceleration for this location also means the typically published value of 9.81 m/s² is also incorrect. In a class where the a core value is that science is that which can be put a laboratory test, the student's values are the values that the students can know to be true. This is what they can prove. And while none are "correct," taken together the values obtained bracket the published value.
Harvey and Thevonna taking timings
Jenna and Rizal recording data
Ozimy and Shane measuring drop times from one meter
Ivan holds the meter sticks while Fiji does the drop
Serjean and Kaylem working at two meters
The only change in the board at 11:00 was to rerun the procedure
With the 8:00 data still on the board, the 11:00 data was added. The median value was 10.015 m/s², just two percent above the value cited for this location. Having the results on the board allowed for a talk on the nature of truth in physical science.


Comments
Post a Comment