Canvas analytics week 16 page views per week
Page views are a proxy statistic for engagement on the Instructure Canvas platform.
The growth in the number of courses, instructors, and students over the past three terms makes discerning common patterns impossible.Vertical axis is logarithmic
Shifting to a logarithmic scale helps, but still makes a fall 2021 on fall 2022 comparison challenging at best.
By rescaling each term against the maximum number of page views during that term, all three terms can be placed on a scale from zero to one. With this rescaling the shared patterns become more evident. The highest number of page views at the term start, thought to be a combination of faculty setting up material at term start and students learning to find their way around the platform. The drop in page views into midterm, and then a midterm increase in page views. The increase is, in relative terms, almost the same for all three terms.After midterm page views decline. The drop in week fourteen spring 2022 was due to spring break.
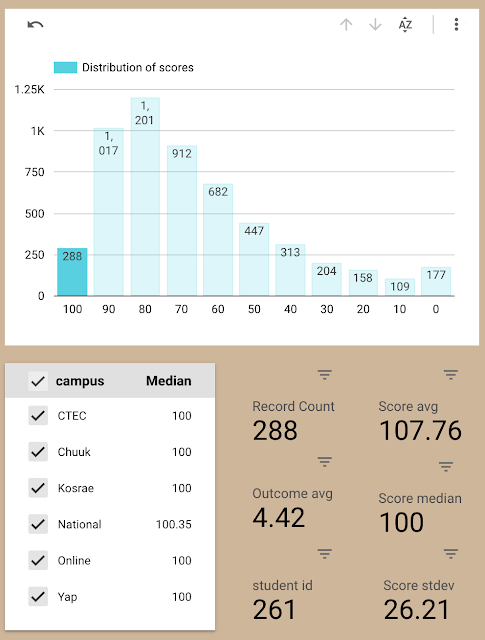
The distribution of current scores systemwide at the end of week fifteen.
Systemwide the current average on Canvas is 71.64 with a median at 77.69. The right skew in the distribution produces the difference between the mean score and median score. The most frequently occurring score band is from 80 to 89. The 288 scores of 100 includes students with 100% or more - in some courses extra credit has pushed some students up above 100%. The median scores by campus generally reflect the systemwide values.
.png)


Comments
Post a Comment