Using the CASE function in DataStudio to generate factors
The college has six campuses with each campus in its own subaccount in the LMS. Attempts to build a dashboard that would output current score data by subaccount ran into the difficulty that the Grade Report CSV export does not provide information on the source subaccount for courses.
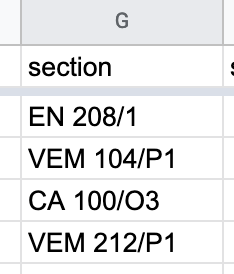

A first attempt was to go after the low hanging fruit of setting up a control to display online or residential courses. All Online courses are in their own subaccount. Online courses have a section designation of /On where n is a single digit integer. At present there are no courses with more than nine sections in a subaccount. The CONTAINS_TEXT function looks for the /O in the section name.
Expanding to handle all six subaccounts required shifting to a CASE function. There was one more complication. Chuuk campus courses are designated by /Cn. There are also, however, courses with /C in the course name such as EN/CO 205 Speech Communication. A CASE function built on the above CONTAINS_TEXT model would assign all EN/CO sections to Chuuk campus as they all contain "/C".
The solution was to use a RIGHT_TEXT function to parse out the rightmost three letters and then apply CONTAINS_TEXT.

At present this works as subaccounts do not currently have more than nine sections of a course. The only subaccount that could conceivably ever exceed nine sections would be the online subaccount.

A control on the dashboard provides the ability to select by campus, cross-filtering allows the control to update the other elements on the dashboard.

The distribution chart is being driven by another calculated field.

FLOOR seemed preferable to ROUND as an 86 should not be rounded up to the 90 band. The chart makes more sense from a grades perspective if FLOOR is used. The column marked 80 corresponds to scores that would earn a B.


Comments
Post a Comment