Ratio level histograms in class
Ratio level histograms were introduced by having the students measure their resting heart rate. The result was a sample of size n of nine resting heart rates in beats per minute:
HR: 45, 50, 50, 51, 52, 55, 57, 60, 61
The minimum was 45, the maximum was 61. The range was 61-45 equals 16. The usual rule is to use the square root of the sample size to determine the number of classes. Classes are also known as intervals. Excel calls classes "bins" and Google Sheets calls classes "buckets." A sample size of nine would normally mean using three classes. To avoid working with fractions, I chose to use four classes each four heartbeats wide (16 ÷ 4 classes = a class width of 4): 45-49, 50-53, 54-57, 57-61.
There was one heart rate between 45 and 49, four between 50 and 53, two between 54 and 57, and two between 58 and 61. This can be turned into a frequency histogram that looks something like:
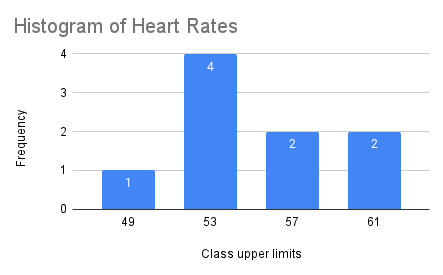
Note that the chart is only displaying class upper limits. Google Sheets can also automatically produce a histogram. I selected the data from A1 to A10 and then clicked on the Chart Wizard. The chart wizard made a line chart, but I then changed that to a histogram in the Chart edit panel.

The result was the following histogram:

While Google has used a class width of five starting from 40, the basic shape of the histogram is the same. The shape of a ratio level histogram often tells us about how the data is distributed between the minimum and maximum. As a result you will hear statisticians talk about a histogram as being a "distribution." As seen above, a ratio level histogram is a column chart with the columns touching each other, no gaps, and shows where data values are found between the minimum and maximum value.
For the heart rate data the most frequently occuring class in the Google histogram above is 50 to 55 beats per minute.


Comments
Post a Comment