Summer session 2021 week two analytics
Week two system wide analytics show twenty active courses led by ten instructors with 250 students engaging in those courses.
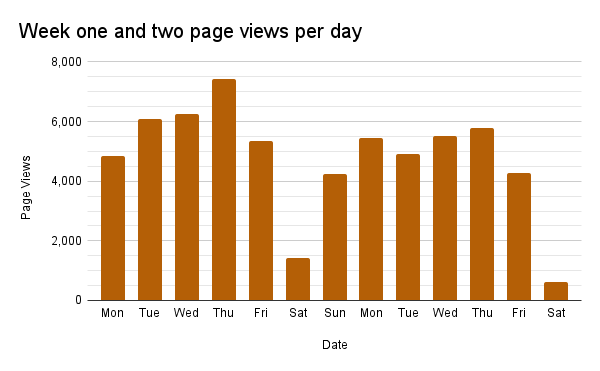
Page views provide a rough measure of engagement levels. There is not enough history in the college data to be certain, but some drop in page views per day from week one to week two might simply be the result of faculty having pushed up page view counts during course set up activities.
Saturday remains the day of lowest engagement with the Canvas platform, with peak engagement again occurring on a Thursday.
In my own courses logins and submissions have shown slight gains. All students have logged in at least once, and almost all of the students have submitted at least one assignment.
The drop in the number of submissions for 3.2, 3.3, and 3.4 may only reflect that some students are working a few days behind the other students. These submission numbers are likely to improve during the coming week. Students have a week to turn in an assignment in the course, and extensions are granted upon request.
SC 130 Physical science is seeing much the same effect where students are submitting over a period of days, some ahead of others. Two students have yet to submit a laboratory report, although for one of the two other work has been submitted. I am working with the one student who has not submitted. The students is working with a 2016 iPhone SE. We are still troubleshooting the absence of the Open with... path for submission that newer iPhones appear to be capable of. I am reminded as we work the issue that every tech problem is unique to the particular device - the issue we are working on has not arisen with other newer iPhone models.
Student learning outcomes for the courses have seen 813 evaluation events to date. These consist of both assignments and quizzes. The dashboard permits selecting to view only assignment based assessments which are derived from rubrics or quiz based assessments which are derived from tests. The above table includes both.


Comments
Post a Comment