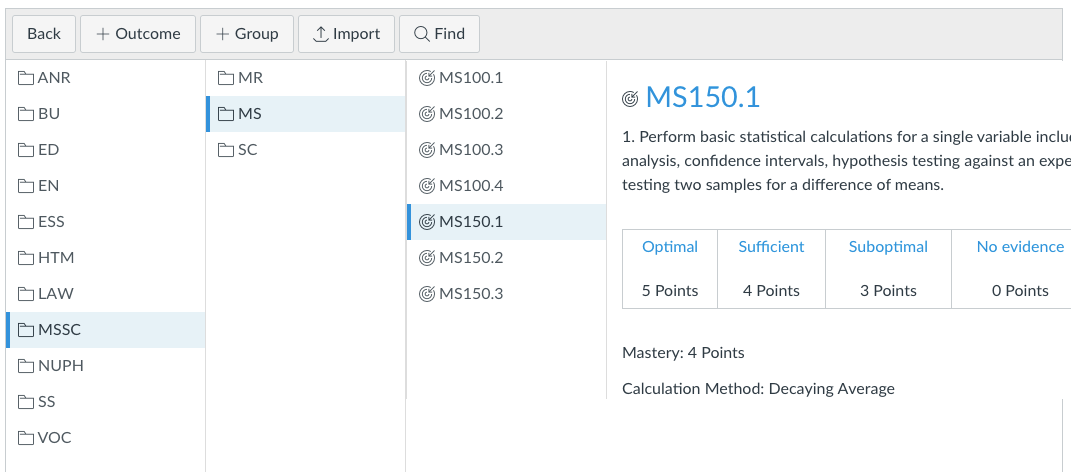
This particular blog is really notes to myself about how I structured outcome data in the institutional account in Canvas. After realizing that using an institutional learning outcomes to program learning outcomes drill down would leave faculty lost in the weeds trying to find a particular student learning outcome, I switched to a course prefix oriented drill down. Aggregation to the program and institutional level is done afterwards in a business intelligence tool.
On the input side the top level is aligned roughly along divisions.
| vendor_guid | object_type | title | description |
| anr | group | ANR | Agriculture |
| b | group | BU | Business |
| edd | group | ED | Education |
| langlit | group | EN | Language and literature |
| kines | group | ESS | Exercise sport science |
| hrtm | group | HTM | Hotel tourism management |
| legal | group | LAW | Law |
| mssc | group | MSSC | Math science |
| nuph | group | NUPH | Nursing public health |
| s | group | SS | Social science |
| v | group | VOC | Career and technical |
The second level is based on course prefixes.
| ac | group | AC | Accounting |
| ag | group | AG | Agriculture |
| ar | group | AR | Art |
| bk | group | BK | Bookkeeping |
| bu | group | BU | Business |
| ca | group | CA | Computer applications |
| chs | group | CHS | Community health |
| ec | group | EC | Economics |
| ed | group | ED | Education |
| en | group | EN | English |
| esl | group | ESL | English second language |
The third level is the actual course learning outcomes.
The result for the user in Canvas is a much more faculty friendly drill down structure based on division and course prefixs.
Faculty only have to include the relevant course learning outcomes on a rubric at some point to generate data that flows into the institutional account.
The Outcome results export file has two columns that are important to the analysis steps.
A dimensions table will use the learning outcome name as a join key and the outcome score will be what is aggregated. Each row in the above table is a single performance, usually a single assignment, in a course.
The dimensions table has the join key in the first column. The rest of the columns are desired aggregation dimensions. If new courses are added, they will have to be added to the join table.
The two tables above are used as data sources and then joined using the Blend Data functionality in Data Studio. Data Studio does have the serious limitation that all tables must join on a common key. If one wants to join three tables using keys shared only pairwise by the table, then one will need another business intelligence tool. For example, if one wanted to join an SIS dimension table to the student names in the results table while joining the learning outcome name in the results table to the outcome dimensions table, that would fail in Data Studio. That said, Data Studio does provide proof of concept that post hoc aggregation can be accomplished.
In other words, aggregation of learning outcomes need not depend on the structure of the outcomes in Canvas.
The challenge ahead is deciding which program learning outcomes a course maps to and to which institutional outcome that program learning outcome maps to. Note that due to the nature of the structure of this particular table the institutional outcome is assigned by course learning outcome and is essentially independent of the program learning outcome chosen. This may yet come back to haunt this design. A fully relational system would allow joins to a program table and from the program table to the institutional table, but Data Studio will not handle these "daisy-chains" of varying keys across tables. Other packages may permit this. That said, a program-to-institutional outcome table can be built and used with a vlookup to enter the appropriate institutional learning outcome if so desired.


Comments
Post a Comment