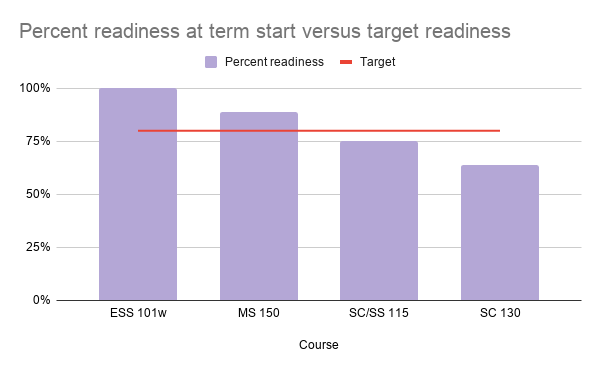
Day one metrics 2020 online in charts
The take home: average readiness for my four courses was 82%
The take home: one in six students has only a smartphone
The take home: half of the students lose access to their courses at Cor Con 3
The take home: The last 6% of the students not logging into Schoology will consume 94% of our efforts


Comments
Post a Comment