Stats video series engagement as measured by views
On day four of MS 150 Statistics, homework is coming in from 33 of my 34 students. All 34 are logging into the Schoology LMS and 33 are able to access Google Sheets through the Google Drive Assignments LTI. The following chart depicts engagement with the stats learning support videos as measured by views.
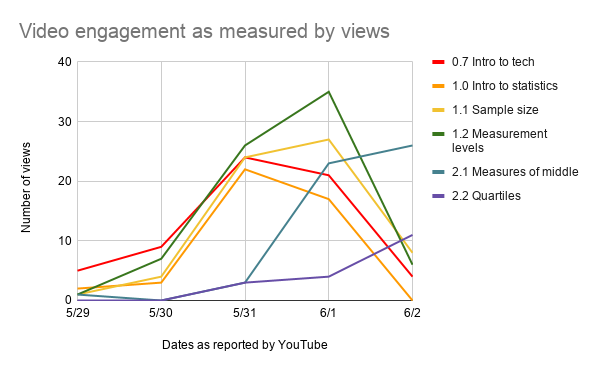 Views is a potentially problematic metric, but serves as best available proxy for engagement.
The dates appear to be off by a day, probably due to the dates being those recorded in California where YouTube is located. That said, there is a distinct rise in viewership as students reach a given section (the prefix numbers) and a fall off as they move on. These are raw views and do not tell one the number of unique viewers. These numbers do, however, suggest that the videos are being accessed by the students as they work on their homework each day.

The dates appear to be off by a day, probably due to the dates being those recorded in California where YouTube is located. That said, there is a distinct rise in viewership as students reach a given section (the prefix numbers) and a fall off as they move on. These are raw views and do not tell one the number of unique viewers. These numbers do, however, suggest that the videos are being accessed by the students as they work on their homework each day.
Comments
Post a Comment