Day one in MS 150 Statistics online
Having some insight into day one on a residential campus requires only that one walk the campus, interact with students and faculty. Having insight into day one for a campus that has moved into cyberspace is more challenging. The faculty are dispersed to their homes, the students scattered across thousands of miles of ocean. From my kitchen table I work with students in four states on five islands in two time zones. There is an invisibility to a cyberspace campus. These two charts provide some visibility in terms of raw numbers for two sections of a single course with 34 students in the course.
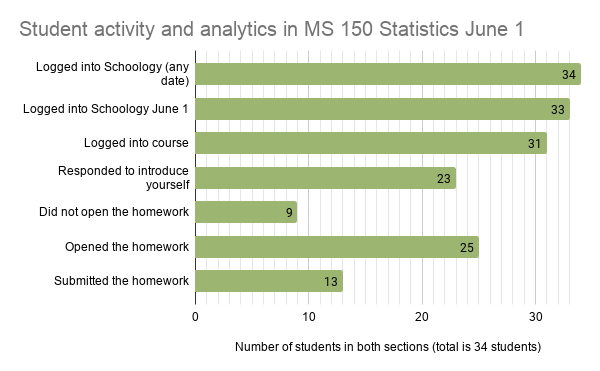


Log in data provided by Schoology Analytics.


Comments
Post a Comment