Mathematical models and the physical science midterm
SC 130 physical science is guided by the idea that the great book of the universe is written in the language of mathematics. The first laboratory of the course opens with my reading of a quote from Freeman Dyson. As this is written, Freeman Dyson has just passed away at the age of 96 years. Dyson wrote,
For a physicist mathematics is not just a tool by means of which phenomena can be calculated, it is the main source of concepts and principles by means of which new theories can be created... ...equations are quite miraculous in a certain way. I mean, the fact that nature talks mathematics, I find it miraculous. I mean, I spent my early days calculating very, very precisely how electrons ought to behave. Well, then somebody went into the laboratory and the electron knew the answer. The electron somehow knew it had to resonate at that frequency which I calculated. So that, to me, is something at the basic level we don't understand. Why is nature mathematical? But there's no doubt it's true. And, of course, that was the basis of Einstein's faith. I mean, Einstein talked that mathematical language and found out that nature obeyed his equations, too.
Dyson was echoing the words of Galileo who said,
[Science] is written in that great book which ever lies before our eyes — I mean the universe — but we cannot understand it if we do not first learn the language and grasp the symbols, in which it is written. This book is written in the mathematical language,...
Today some physicists argue that the book of the universe is not just written in the language of mathematics, the book itself is mathematical.
...the bottom line is that if you believe in an external reality independent of humans, then you must also believe that our physical reality is a mathematical structure. Nothing else has a baggage-free description. In other words, we all live in a gigantic mathematical object—one that’s more elaborate than a dodecahedron, and probably also more complex than objects with intimidating names such as Calabi-Yau manifolds, tensor bundles and Hilbert spaces, which appear in today’s most advanced physics theories. Everything in our world is purely mathematical—including you. - Max Tegmark
For 500 years mathematics has been the guiding light of physical science. The mathematics leads to models, theories, predictions, and replicability. Physical science should never be viewed as being primarily composed of accumulated facts. Physical science is, and has always been, a mathematical exploration of Galileo's universe.
In that spirit, the midterm presents the students with data for a system that they have not previously encountered and asks the students to analyze and discuss the nature of the relationship between the variables in the system.
This approach to the midterm was first tried fall 2019 and was found to provide insight into the students abilities "to analyze a system, to 'do science', rather than [to acquire] memorized knowledge that will vanish within days of the end of the term. The students are learning a process, and learning science as based on observables, measurables. Just as one remembers how to do something learned long ago, so too I would expect these students will long remember how to engage in exploration of data."

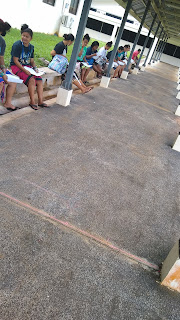
The recommendation fall 2019 was to repeat the exercise spring 2020. The class began on the sidewalk - this term one student had seen me chalking the sidewalk prior to class and waited for the class to start. The rest of the class sat down with the first student.
I gathered data on four runs this term starting with a minimum speed slow run on a RipStik castor board, then a medium speed run, then the highest speed I could achieve, and finally a fourth intermediate speed run. I opted not to argue for nor include a rate zero, speed zero data point. I wanted to leave the matter of a possible y-intercept in the hands of measurable data.

I reordered the data on the board so the data would be in ascending order, there is also an inadvertent rounding error for the fastest velocity.
The students were told to work with a partner or, at their option, to work alone. They were instructed to form pairs where at least one partner had access to Desmos. The students had to enter the data and run their own analysis. The instructions provided to the students in a handoutwas:
In the demonstration and data gathering phase you will gather data on the swizzle rate and velocity of the RipStik. You are to use this data to explore the relationship between the swizzle rate and velocity of the RipStik. Note that swizzle rate is in swizzles per second, velocity will be in meters per second. Make a hand sketch of the graph you make in Desmos. You should provide data based support for your discussion, analysis, and conclusions. Write up your work on this paper. Work alone or in pairs, put both names on the paper if working in a pair. Consider the following:
Write up your discussion, analysis, and conclusions using complete sentences. Explain your results.

Above is a Desmos screenshot of what a student might see when they enter the data. The data is arguably linear and suggests a possible zero y-intercept. The decision to not argue for a y-intercept of zero seems to have been beneficial. Last term the inclusion of the (0,0) as a data point led to the suggestion that the data might be non-linear, possibly fittable to a parabolic curve. While this term the data might not have suggested non-linearity had (0,0) been included, leaving (0,0) out was in retrospect the correct decision. Using four runs was also beneficial, as was meeting at the sidewalk and thus gaining more time for data gathering.

Ten students chose to work as pairs, five students opted to work alone this term. For a midterm this might seem unusual - the pairs share a common grade. Yet this approach is intended to mirror the nature of the modern workplace where one is more often a member of a team working to achieve a goal. Success rides on teamwork. The students who paired picked their own partner.

Of the 15 responses included graphs and provided some sort of analysis of the data. Ten responses explicitly said that the data was linear. Eleven responses described the relationship in writing. Nine reported an equation, although only seven of nine reported the value of the slope. Two reported only the linear equation. Separately two other responses reported the slope without an equation, thus nine responses included the slope. Overall eleven of fifteen either arrived at both an equation and a slope value or obtained one of those. This suggests that 73% of the students could get from raw data to some sort of mathematical relationship describing the system.
Of some note is that this term all of the students wrapped up within an hour of the start of class. Last term some students worked for up to 90 minutes on the exercise. This term did see the deletion of the requirement to include a data table with caption - that seemed redundant as the data table was on the whiteboard. That deletion would not explain a 30 minute difference. Having watched the students work I do not think the difference is any other than random variation from class to class.
As observed last term the students worked independently and diligently, spending more time on this exercise than they would have spent on a traditional midterm examination in the class. No student simply "gave up" and left questions blank - something that does occur on a traditional midterm in the course. The midterm was well aligned to what the course had been focused on since the first week: gathering data, analyzing systems, explaining the relationship between variables, and finding mathematical models.
The overall average was 84% with a section one average of 79% and a section two average of 89%. No response scored below 28/42 points on the rubic (67%).
For a physicist mathematics is not just a tool by means of which phenomena can be calculated, it is the main source of concepts and principles by means of which new theories can be created... ...equations are quite miraculous in a certain way. I mean, the fact that nature talks mathematics, I find it miraculous. I mean, I spent my early days calculating very, very precisely how electrons ought to behave. Well, then somebody went into the laboratory and the electron knew the answer. The electron somehow knew it had to resonate at that frequency which I calculated. So that, to me, is something at the basic level we don't understand. Why is nature mathematical? But there's no doubt it's true. And, of course, that was the basis of Einstein's faith. I mean, Einstein talked that mathematical language and found out that nature obeyed his equations, too.
Dyson was echoing the words of Galileo who said,
[Science] is written in that great book which ever lies before our eyes — I mean the universe — but we cannot understand it if we do not first learn the language and grasp the symbols, in which it is written. This book is written in the mathematical language,...
Today some physicists argue that the book of the universe is not just written in the language of mathematics, the book itself is mathematical.
...the bottom line is that if you believe in an external reality independent of humans, then you must also believe that our physical reality is a mathematical structure. Nothing else has a baggage-free description. In other words, we all live in a gigantic mathematical object—one that’s more elaborate than a dodecahedron, and probably also more complex than objects with intimidating names such as Calabi-Yau manifolds, tensor bundles and Hilbert spaces, which appear in today’s most advanced physics theories. Everything in our world is purely mathematical—including you. - Max Tegmark
For 500 years mathematics has been the guiding light of physical science. The mathematics leads to models, theories, predictions, and replicability. Physical science should never be viewed as being primarily composed of accumulated facts. Physical science is, and has always been, a mathematical exploration of Galileo's universe.
In that spirit, the midterm presents the students with data for a system that they have not previously encountered and asks the students to analyze and discuss the nature of the relationship between the variables in the system.

A ten meter RipStik run was used to gather data
This approach to the midterm was first tried fall 2019 and was found to provide insight into the students abilities "to analyze a system, to 'do science', rather than [to acquire] memorized knowledge that will vanish within days of the end of the term. The students are learning a process, and learning science as based on observables, measurables. Just as one remembers how to do something learned long ago, so too I would expect these students will long remember how to engage in exploration of data."

The recommendation fall 2019 was to repeat the exercise spring 2020. The class began on the sidewalk - this term one student had seen me chalking the sidewalk prior to class and waited for the class to start. The rest of the class sat down with the first student.
I gathered data on four runs this term starting with a minimum speed slow run on a RipStik castor board, then a medium speed run, then the highest speed I could achieve, and finally a fourth intermediate speed run. I opted not to argue for nor include a rate zero, speed zero data point. I wanted to leave the matter of a possible y-intercept in the hands of measurable data.

I reordered the data on the board so the data would be in ascending order, there is also an inadvertent rounding error for the fastest velocity.
The students were told to work with a partner or, at their option, to work alone. They were instructed to form pairs where at least one partner had access to Desmos. The students had to enter the data and run their own analysis. The instructions provided to the students in a handoutwas:
In the demonstration and data gathering phase you will gather data on the swizzle rate and velocity of the RipStik. You are to use this data to explore the relationship between the swizzle rate and velocity of the RipStik. Note that swizzle rate is in swizzles per second, velocity will be in meters per second. Make a hand sketch of the graph you make in Desmos. You should provide data based support for your discussion, analysis, and conclusions. Write up your work on this paper. Work alone or in pairs, put both names on the paper if working in a pair. Consider the following:
- What is the mathematical nature of the relationship between the swizzle rate and the velocity of the RipStik?
- How is the swizzle rate related to the velocity of the RipStik?
- What is the mathematical equation for the relationship between the swizzle rate and the velocity of the RipStik?
Write up your discussion, analysis, and conclusions using complete sentences. Explain your results.

Desmos with data entered on a smartphone
Above is a Desmos screenshot of what a student might see when they enter the data. The data is arguably linear and suggests a possible zero y-intercept. The decision to not argue for a y-intercept of zero seems to have been beneficial. Last term the inclusion of the (0,0) as a data point led to the suggestion that the data might be non-linear, possibly fittable to a parabolic curve. While this term the data might not have suggested non-linearity had (0,0) been included, leaving (0,0) out was in retrospect the correct decision. Using four runs was also beneficial, as was meeting at the sidewalk and thus gaining more time for data gathering.

A pairs response
Ten students chose to work as pairs, five students opted to work alone this term. For a midterm this might seem unusual - the pairs share a common grade. Yet this approach is intended to mirror the nature of the modern workplace where one is more often a member of a team working to achieve a goal. Success rides on teamwork. The students who paired picked their own partner.

Of the 15 responses included graphs and provided some sort of analysis of the data. Ten responses explicitly said that the data was linear. Eleven responses described the relationship in writing. Nine reported an equation, although only seven of nine reported the value of the slope. Two reported only the linear equation. Separately two other responses reported the slope without an equation, thus nine responses included the slope. Overall eleven of fifteen either arrived at both an equation and a slope value or obtained one of those. This suggests that 73% of the students could get from raw data to some sort of mathematical relationship describing the system.
Of some note is that this term all of the students wrapped up within an hour of the start of class. Last term some students worked for up to 90 minutes on the exercise. This term did see the deletion of the requirement to include a data table with caption - that seemed redundant as the data table was on the whiteboard. That deletion would not explain a 30 minute difference. Having watched the students work I do not think the difference is any other than random variation from class to class.
As observed last term the students worked independently and diligently, spending more time on this exercise than they would have spent on a traditional midterm examination in the class. No student simply "gave up" and left questions blank - something that does occur on a traditional midterm in the course. The midterm was well aligned to what the course had been focused on since the first week: gathering data, analyzing systems, explaining the relationship between variables, and finding mathematical models.
The overall average was 84% with a section one average of 79% and a section two average of 89%. No response scored below 28/42 points on the rubic (67%).


Comments
Post a Comment