Waves
Waves opened with a four sheet RipStik wave on the sidewalk. The speed was reduced to push the amplitude. The run requires a stopwatch and a tape measure for use post-run.


Reducing the forward speed and focusing on deep cycling of the RipStik enhanced the wave form.

Wavelength was covered first and then the amplitude. The average wavelength was computed from 3.35 meters divided by 2.5 waves. The students decided that 2.5 waves were present.

Then the period and frequency.

Wrap included the sine function and the wave speed (seen on the leftmost sheet above).

Equipment for Wednesday.

Wednesday wrapped up with an oscilloscope app to show that sound waves are sine waves two. A function generator app was also used.

Thursday's measurement of the speed of sound requires a fair amount of equipment and I still forgot to bring a pen. Not shown: a pocket knife to cut the tape in the event field repairs to the clappers might have been needed.

Zero for the morning section was on the alignment of a soursop (sei) and a soccer goal.

This kept the clapper out of the morning traffic just to the west of the eastern entrance to the college half moon driveway.


First distance attempted was 250 meters, Mayson on the towel and recording duty.


Final position was 475 meters down near the agriculture classroom, Dickenson and Rodman timing. Five timers plus myself were deployed.

Times were reported to Ellena after she traded her timer to Mayson in exchange for recording duty. Joyceleen reporting in, Rodman, Mauriney, and Dickenson wait to report.

The view from 475 meters. Darall could still be seen with the naked eye but is all but invisible to a smartphone camera. As Jerick would later note with surprise in the afternoon section, "We can hear farther than we can see."

Ellena recording data while Mauriney checks a time.

Darall and Joyann, who had been on communications, had already settled in under a Terminalia catappa tree.

Desmos can be used in a quite advanced manner at this point, above are times entered as lists.

The median value can then be calculated for each list.

Boxplots of the data can be displayed

The data table can use the median time variables set up above, the regression yields a sound speed of 356 meters per second.

The graph can display both the regression line and the data boxplots, a nice way to present the data.

In the afternoon section I remembered that I had not actually put the purpose of the laboratory up on the board, although this had been explained the day belofre.

Jerick would take over recording, while James is rolling the surveyor's wheel.

Out at the agriculture classroom the distance was 488 meters as clapper Kimmy was slightly east of Darall's morning position. The morning class maxed out at 475. Although the midday sun was hot, the class wanted to do one more, and pushed on out to 549 meters. From 549 meters I was challenged to see Kimmy's clap, but I could still make it out. This is where Jerick noted one can hear farther than one can see.

The afternoon data would prove to be more problematic than the morning data.
 There did not seem to be obvious timing issues in the field.

The box plots, however, displayed a larger variation in values for each distance. And the graph suggested an upward curve with the last three data points.
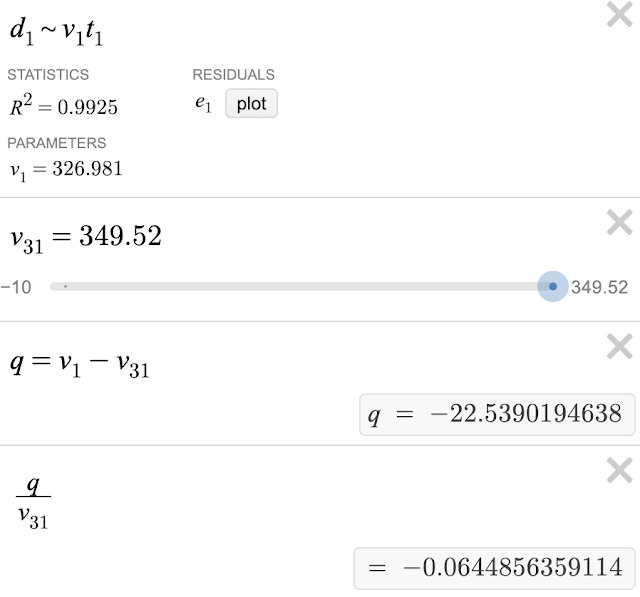
The slope would be low at 327 m/s against an estimated sound speed of 350 m/s at 31 Celsius, about 6% below the expected value.
Perhaps the heat of midday was a factor. There was also a fair amount of noise along the road, including at the critical timing end of the lab - an excavator was taking out all of the lime and calamansi trees as part of some sort of work on the gym's leaching field.
Friday will wrap up with waves in art and music, a video playlist, as a way to expand the students horizons on the interplay between science and art.


Reducing the forward speed and focusing on deep cycling of the RipStik enhanced the wave form.

Wavelength was covered first and then the amplitude. The average wavelength was computed from 3.35 meters divided by 2.5 waves. The students decided that 2.5 waves were present.

Then the period and frequency.

Wrap included the sine function and the wave speed (seen on the leftmost sheet above).

Equipment for Wednesday.

Wednesday wrapped up with an oscilloscope app to show that sound waves are sine waves two. A function generator app was also used.

Thursday's measurement of the speed of sound requires a fair amount of equipment and I still forgot to bring a pen. Not shown: a pocket knife to cut the tape in the event field repairs to the clappers might have been needed.

Zero for the morning section was on the alignment of a soursop (sei) and a soccer goal.


Darall was the designated clapper

First distance attempted was 250 meters, Mayson on the towel and recording duty.

Joyceleen timing, Dickenson retrieving a timer

Final position was 475 meters down near the agriculture classroom, Dickenson and Rodman timing. Five timers plus myself were deployed.

Times were reported to Ellena after she traded her timer to Mayson in exchange for recording duty. Joyceleen reporting in, Rodman, Mauriney, and Dickenson wait to report.

The view from 475 meters. Darall could still be seen with the naked eye but is all but invisible to a smartphone camera. As Jerick would later note with surprise in the afternoon section, "We can hear farther than we can see."

Ellena recording data while Mauriney checks a time.

Darall and Joyann, who had been on communications, had already settled in under a Terminalia catappa tree.

Desmos can be used in a quite advanced manner at this point, above are times entered as lists.

The median value can then be calculated for each list.

Boxplots of the data can be displayed

The data table can use the median time variables set up above, the regression yields a sound speed of 356 meters per second.

The graph can display both the regression line and the data boxplots, a nice way to present the data.

In the afternoon section I remembered that I had not actually put the purpose of the laboratory up on the board, although this had been explained the day belofre.

Jerick would take over recording, while James is rolling the surveyor's wheel.

Out at the agriculture classroom the distance was 488 meters as clapper Kimmy was slightly east of Darall's morning position. The morning class maxed out at 475. Although the midday sun was hot, the class wanted to do one more, and pushed on out to 549 meters. From 549 meters I was challenged to see Kimmy's clap, but I could still make it out. This is where Jerick noted one can hear farther than one can see.

The afternoon data would prove to be more problematic than the morning data.


The box plots, however, displayed a larger variation in values for each distance. And the graph suggested an upward curve with the last three data points.
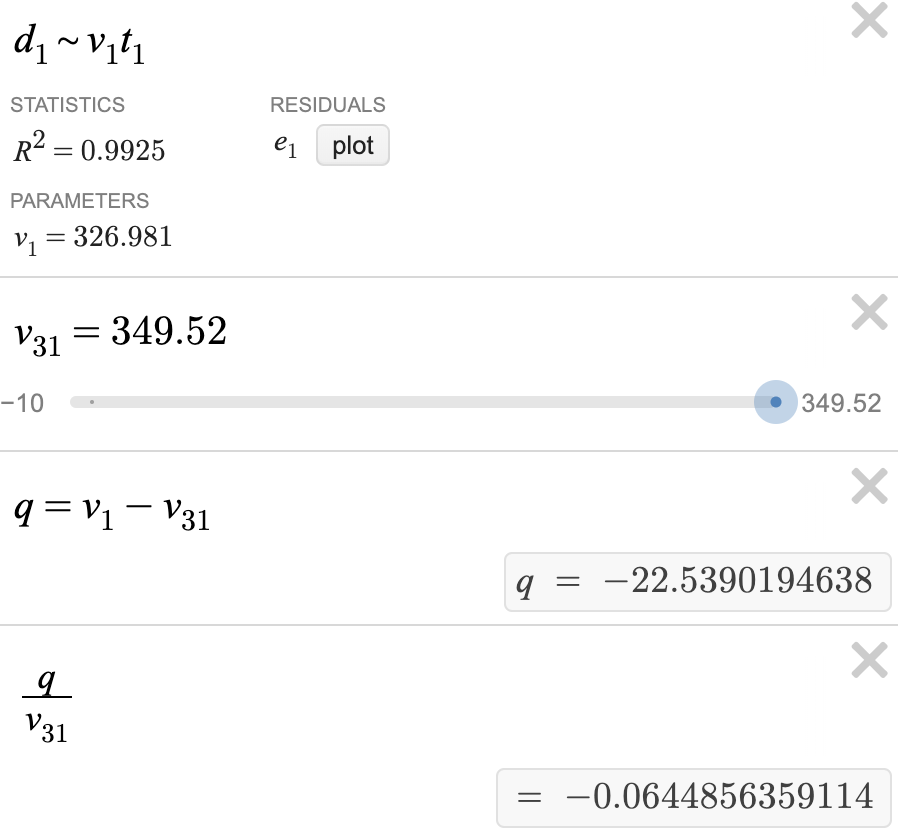
The slope would be low at 327 m/s against an estimated sound speed of 350 m/s at 31 Celsius, about 6% below the expected value.
Perhaps the heat of midday was a factor. There was also a fair amount of noise along the road, including at the critical timing end of the lab - an excavator was taking out all of the lime and calamansi trees as part of some sort of work on the gym's leaching field.
Friday will wrap up with waves in art and music, a video playlist, as a way to expand the students horizons on the interplay between science and art.
Comments
Post a Comment