From Schoology Institutional Mastery to Nuventive TracDat without manually counting the stars
Assignments in my courses are linked to student learning outcomes in Schoology Institutional using the Learning Objectives capability.
At term end I export the Schoology gradebook to run analyses including gender splits in a spreadsheet.
Into the exported spreadsheet I insert columns for gender and gender split calculations.
These are calculations that take the overall course average and split the data by gender, allowing me to look at whether there are gender differentials in performance. The gender splitting functions have the form:
=if(C2="F",D2,"")
=if(C2="M",D2,"")
where C holds the gender code and D the course average. The first function is in column E (Fem) and the second function is in column F (Mal). At the bottom of the E and F columns the AVERAGE function is inserted to calculate the average. Google Sheets is used to produce the analysis and charts.
I use the Mastery screen in Schoology to determine learning against the course student learning outcomes.
I measure success not by the percentages, but by a student having demonstrated the necessary skill at least five performances at 70% or better on the learning task. In the world of Schoology this generates a green star on the mastery report screen.
[For those unfamiliar with the above screen, the above is going to be confusing. The small number at the upper right is the number of times a particular student performed a task against the learning outcome listed at the top. Each row is a student. Each column a learning outcome. I changed mastery from a default of being met once to being met 5 or more times. Thus the student with a 68.13% on the student learning outcome (learning objective) 1.0 performed against that outcome 17 times. While their average was 68%, at least five were above 70%.
Note in the third column the 100% with no star: The student achieved a perfect performance on two of seven times this learning outcome came up in class. Two demonstrations is not sufficient for mastery, hence no star. A student needs to demonstrate the skill or knowledge at least five times.]
The college assessment software, Nuventive TracDat, requires success rates for females and males. Schoology does not provide a way to slice the data by gender. So I am left counting stars on the computer screen manually.
Then I realized that I can export the mastery settings summary which retains the same order as the grade book.
The Export Summary exports mastery data. The Mastered column contains information on whether a star is present (1) or absent (0).
For purposes of having the data in one single spreadsheet, I copy and paste the Mastered column to the already exported Schoology gradebook export spreadsheet.
The same gender splitting function mentioned above is used in P and Q. Simple SUM functions at the bottom will count "the green stars" by gender.
Note that I altered the layout as I refined this process with each successive course I was working upon. H, I, and J contain the mastery data for three learning outcomes in SC/SS 115 Ethnobotany. The gender column is off screen to the left.
At the bottom a set of concatenation functions assemble the data.
="[national] "&H33&" ("&K33&" females; "&N33&" males ) out of "&H32&" students ("&round(100*H34,0)&"%) successfully completed this CSLO."
These are then copied and pasted into a field in Nuventive Improve (TracDat).
Counting the stars by manually tended to make the iMac Retina screen I work on greasy, especially after lunch, not to mention that the manual process was prone to errors leading to recounts. Realizing that I could use the Mastery screen export function will keep my screen cleaner and, in the long run, save me time.
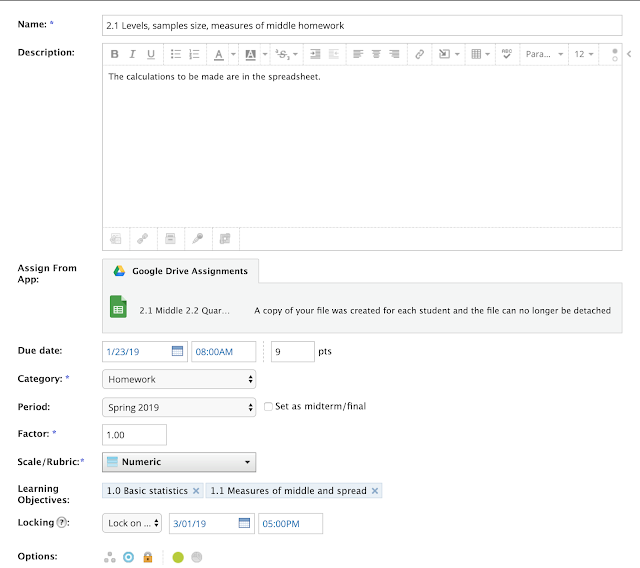
Note that for this to work, one has to have assigned learning outcomes to materials in Schoology, a topic I covered in December.
This is filed under "Notes to myself because I only have to do this twice a year and I forget what I did the time before."


Comments
Post a Comment