Interpreting numeric information in graphic forms pre and post-assessment
General education program learning outcome 3.2 states that students will be able to present and interpret numeric information in graphic forms. With this focus in mind, a pre-assessment and post-assessment was included in the SC 130 Physical Science course. In the past the post-assessment was embedded in the final examination, as seen in the final examination of fall 2017. With the decision to redesign and repurpose the final examination, the post assessment was integrated into a test at the end of the week fourteen.
The students had no knowledge that the test would include the pre-assessment. The intent was to measure not what the students can accomplish by studying, but what they know without preparation. In this sense the intent was to mimic the pre-assessment which was administered on the first day of class. The hope is to measure what the students know without studying - to potentially get at longer term retention.
SC 130 Physical Science includes a focus on the mathematical models that underlie physical science systems. Laboratories one, two, four, five, seven, nine, eleven, twelve, and fourteen have linear relationships. A number of assignments in the course also have linear relationships. The students also encounter a quadratic relationship in laboratory three, now modeled as a quadratic using Desmos' ability to regress to any arbitrary function. By the end of the course students have repeatedly worked with linear relations. One relationship, one equation, at a time, not "problems one to thirty, even problems only." Every equation is built from data that the students have gathered. From the concrete to the abstract, repeated throughout the term, providing cognitive hooks on which to "hang" their mathematical learning.
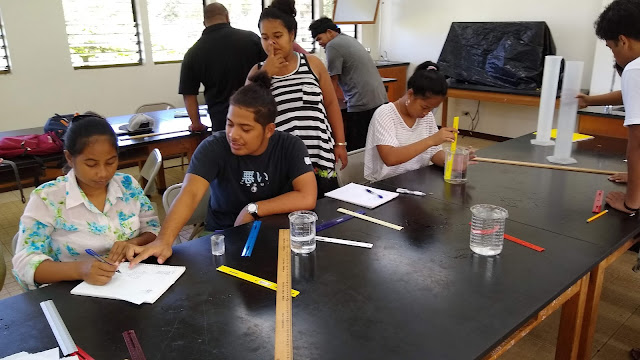
Nemely and Rangpino consider their index of refraction data
The students had no knowledge that the test would include the pre-assessment. The intent was to measure not what the students can accomplish by studying, but what they know without preparation. In this sense the intent was to mimic the pre-assessment which was administered on the first day of class. The hope is to measure what the students know without studying - to potentially get at longer term retention.
SC 130 Physical Science includes a focus on the mathematical models that underlie physical science systems. Laboratories one, two, four, five, seven, nine, eleven, twelve, and fourteen have linear relationships. A number of assignments in the course also have linear relationships. The students also encounter a quadratic relationship in laboratory three, now modeled as a quadratic using Desmos' ability to regress to any arbitrary function. By the end of the course students have repeatedly worked with linear relations. One relationship, one equation, at a time, not "problems one to thirty, even problems only." Every equation is built from data that the students have gathered. From the concrete to the abstract, repeated throughout the term, providing cognitive hooks on which to "hang" their mathematical learning.
In the fall of 2018 average performance increased from a success rate of 48% on the pre-assessment to 71% on the post-assessment. Students showed improvement on every item. The amount of improvement is in line with the improvement seen in prior terms.
While the post-assessment does not answer whether there will be long term student retention of the ability to present and interpret numeric information in graphic forms, the shift of the post-assessment to the week fourteen test should provide a better measurement of what the students can do without specifically studying. This may provide better insight into longer term retention.
That performance improved on every question is encouraging. The students are far more competent and perhaps confident in their mathematical skills and understanding. This particular term in physical science has seen a focus on the mathematical models aspect of the course. Whether the universe is either mathematical, or in Max Tegmark's view IS mathematics, was tackled in a video shown this term. The countervailing argument of Sabine Hossenfelder's Lost in Math: How Beauty Leads Physics Astray was also approached in a set of videos, but there on fewer online resources that illuminate that new book.
Nineteen of the 25 students reported their current or most recent math course. Of the 19, 18 students were in MS 100 College Algebra or higher. The low performance seen on the pre-assessment is not evidence that the course needs a math pre-requisite, the low performance is evidence that math courses do not engender retained learning.
This lack of retention of algebraic reasoning skills is a reason that concern over longer term retention is a focus of the SC 130 Physical Science course. This is also a reason that I support alternate paths to quantitative literacy beyond the current singular path that runs all students through MS 100 College Algebra. Ultimately, showing long term comprehension would require post-graduation follow-up, which is not currently feasible.


Comments
Post a Comment